
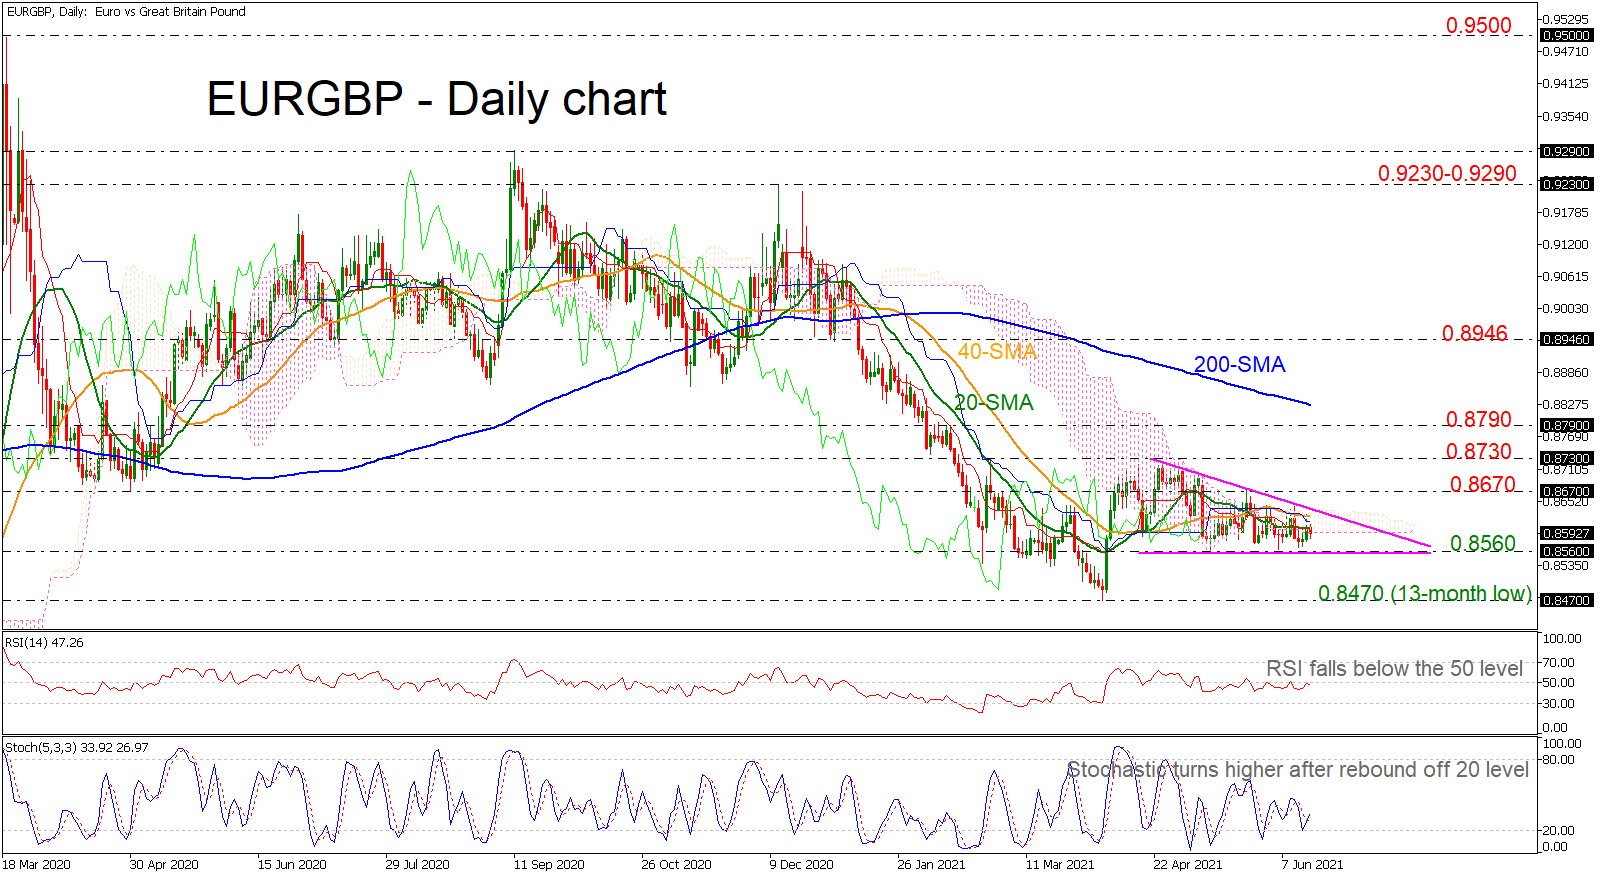
EURGBP has been trading in a short-term descending triangle over the last two months with the top border at the 0.8730 resistance and the lower border at the 0.8560 support. The pair is trading below the flat 20- and 40-day simple moving averages (SMAs) and within the Ichimoku cloud. The stochastic is travelling upwards after the positive cross within the %K and %D lines, while the RSI is sliding down just below the 50 level.
A penetration of the triangle to the upside the 0.8760 area might be reached ahead of the 0.8730-0.8790 resistance region. More bullish swings might lead to a test of the 200-day SMA, which is now at 0.8825. A successful overtake might push the bulls all the way to 0.8946.
On the other hand, a collapse below the 0.8560 support, might send the market to a 13-month low of 0.8470, ahead of the February 2020 bottom of 0.8280.
To summarize, EURGBP is neutral in the short term but bearish in the medium-term view. Any drops below the 13-month trough of 0.8470 will bolster the negative outlook.


