
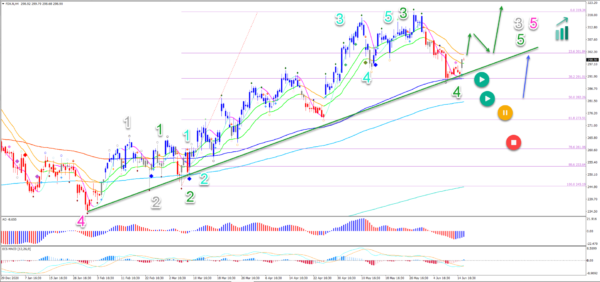
- FedEx Corporation (FDX) has made a bullish bounce. But the rebound was even stronger than expected because price action broke above the top.
- The main targets are located at the -27.2% Fibonacci level at $340 and the -61.8% Fibonacci level at $365.
- A bullish bounce took place at the 38.2% Fibonacci level, which makes a wave 4 likely. A bullish breakout above the 21 ema high could confirm the uptrend continuation.
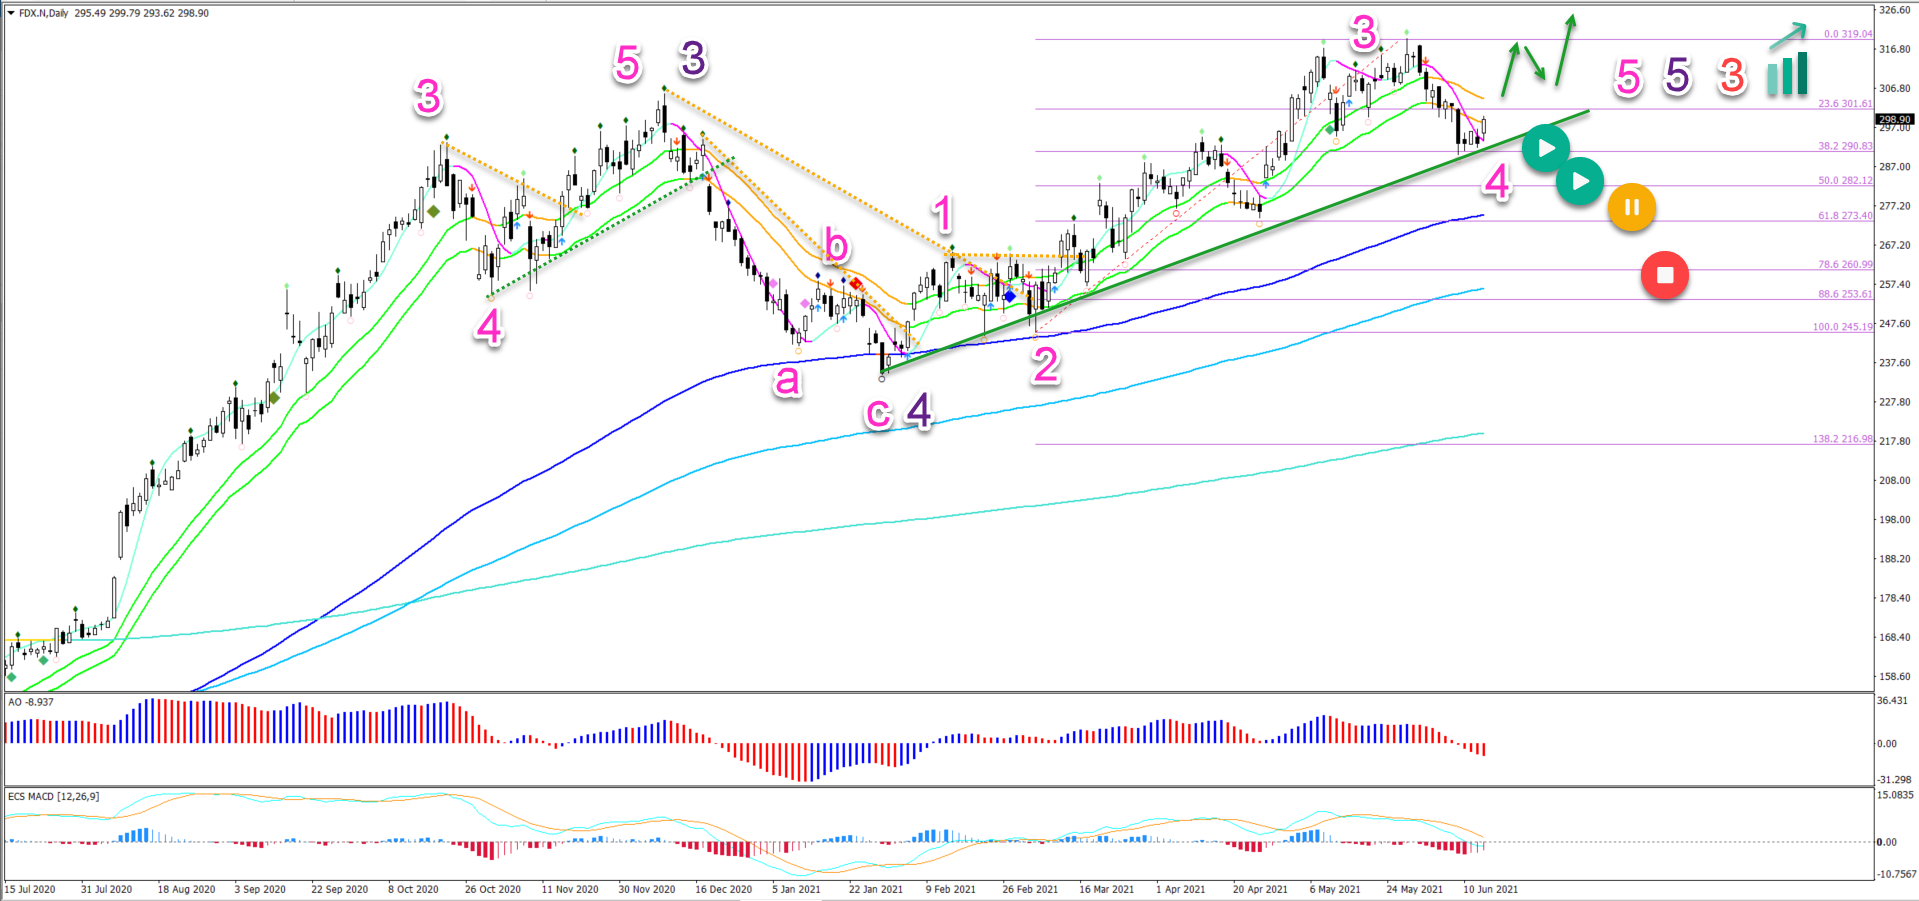
The FDX daily chart is showing a strong uptrend with all the moving averages bullishly aligned:
- The previous price swing is a wave 3 (purple) of wave 3 (red) due to its steep angle.
- The pullback was indeed a wave 4 (purple) which bounced at the 144 ema.
- The current higher high is expected to be part of a wave 5 (purple) of wave 3 (red).
- Within the wave 5 (purple), price action is building a 5 wave (pink) pattern. The current push up seems to be a wave 3 (pink).
- The current pullback could be a wave 4 (pink) as long as price action stays above the 50% Fibonacci level.
- A break below the 50% Fib places it on hold (orange circle) and a deeper break invalidates it (red circle).
- The main targets are located at the -27.2% Fibonacci level at $340 and the -61.8% Fibonacci level at $365.
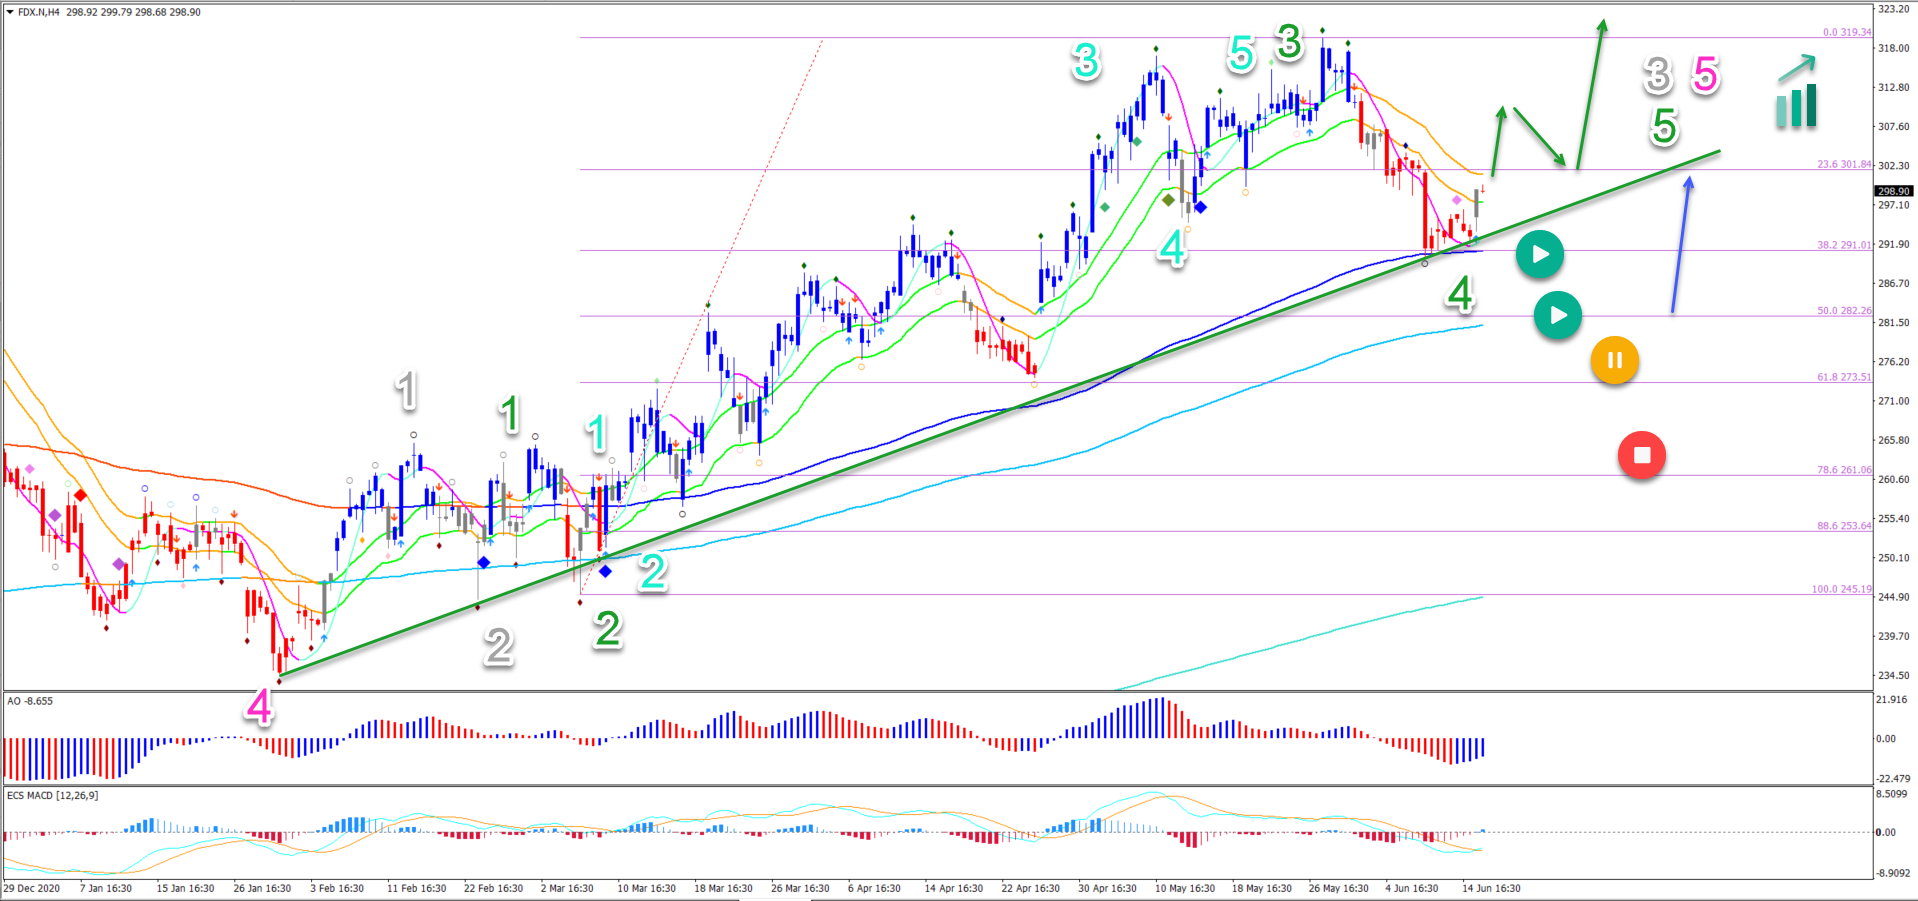
On the 4 hour chart, price action could be testing the support trend line (green):
- A bullish bounce took place at the 38.2% Fibonacci level, which makes a wave 4 (green) likely.
- A bullish breakout above the 21 ema high could confirm the uptrend continuation (green arrows).
- Price action should stay above the 50% Fibonacci level if this is indeed a wave 4 (green).
- A bullish bounce (blue arrow) could take place at the 50% Fib as well if price action gets there.


