
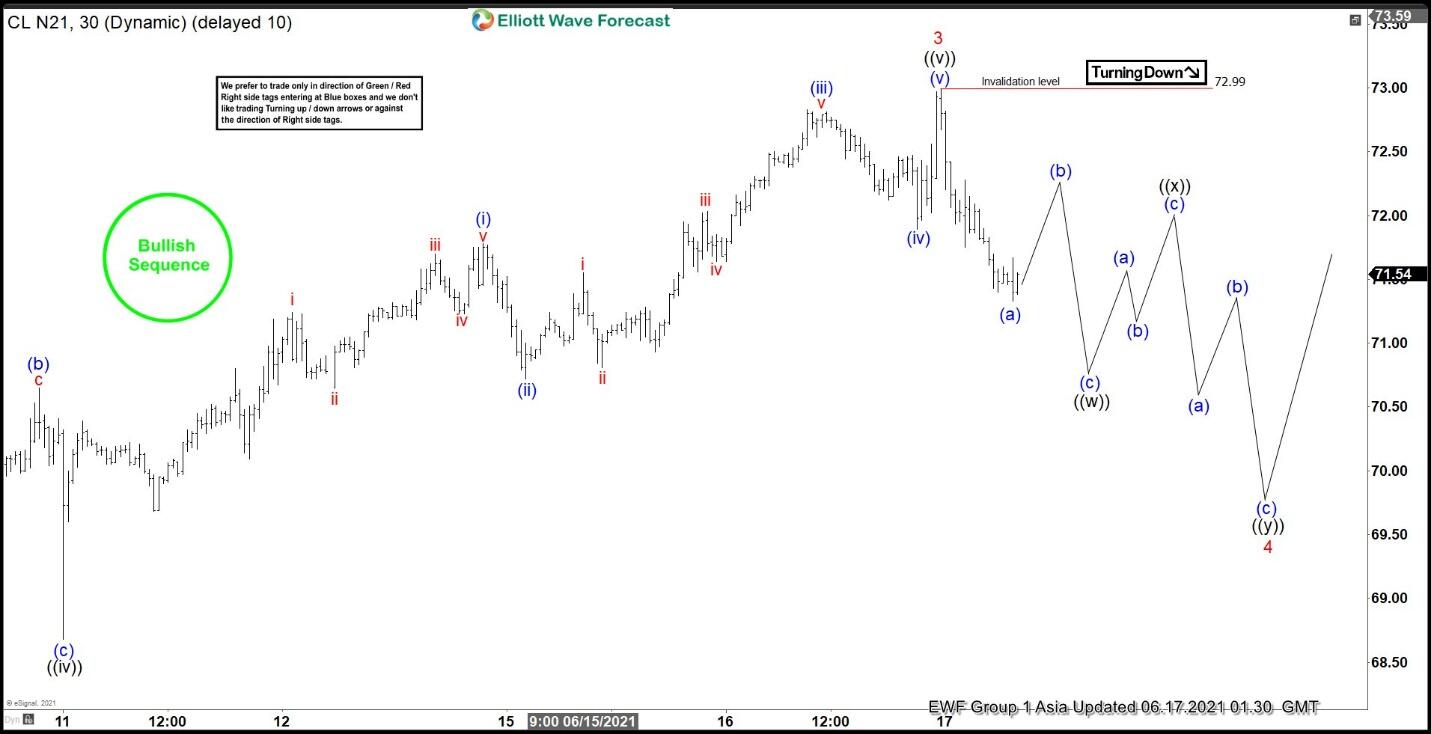
Short Term Elliott Wave view in Oil (CL) suggests the rally from March 24 low is unfolding as an impulse Elliott Wave structure. Up from March 24 low, wave 1 ended at 67.02, and pullback in wave 2 ended at 61.56. Wave 3 rally is proposed complete at $73 as the 30 minutes chart below shows. Pullback in wave 4 is currently in progress to correct cycle from May 21 low before the rally resumes.
Structure of the decline from wave 3 is unfolding as a double three Elliott Wave. A double three is a 7 swing structure and sometimes also referred to as a double zigzag when each leg is a zigzag structure. Down from wave 3, wave (a) ended at $71.33. While wave (b) rally fails below $73, expect Oil to turn lower again in wave (c) to complete wave ((w)). Afterwards, expect a rally in wave ((x)) to correct the decline from June 16 peak before another 3 waves down to complete wave ((y)) of 4.
Potential target for wave 4 is 23.6 – 38.2% Fibonacci retracement of wave 3 which comes at $68.6 – $70.3 area. Once CL completes wave 4, it should then resume to new high again. Near term, as far as pivot at $73 high is intact, expect rally to fail in 3, 7, 11 swing for further downside to complete wave 4 correction.
Oil 30 Minutes Elliott Wave Chart


 Elliott Wave: Incomplete Sequences Forecasting The Path")
