
- Yesterday’s EUR/USD daily candle ended very bearish after breaking below the 21 ema low – as expected in our EUR/USD video. Bearish is now firmly in a bearish price swing.
- The wave 3 (blue) is probably part of a larger wave 3 (orange) and wave 3 (grey).
- The main targets are the -1.618% FIb at 1.1915, the -2% Fib at 1.1865 and -2.618% Fib at 1.1782.
Price charts and technical analysis
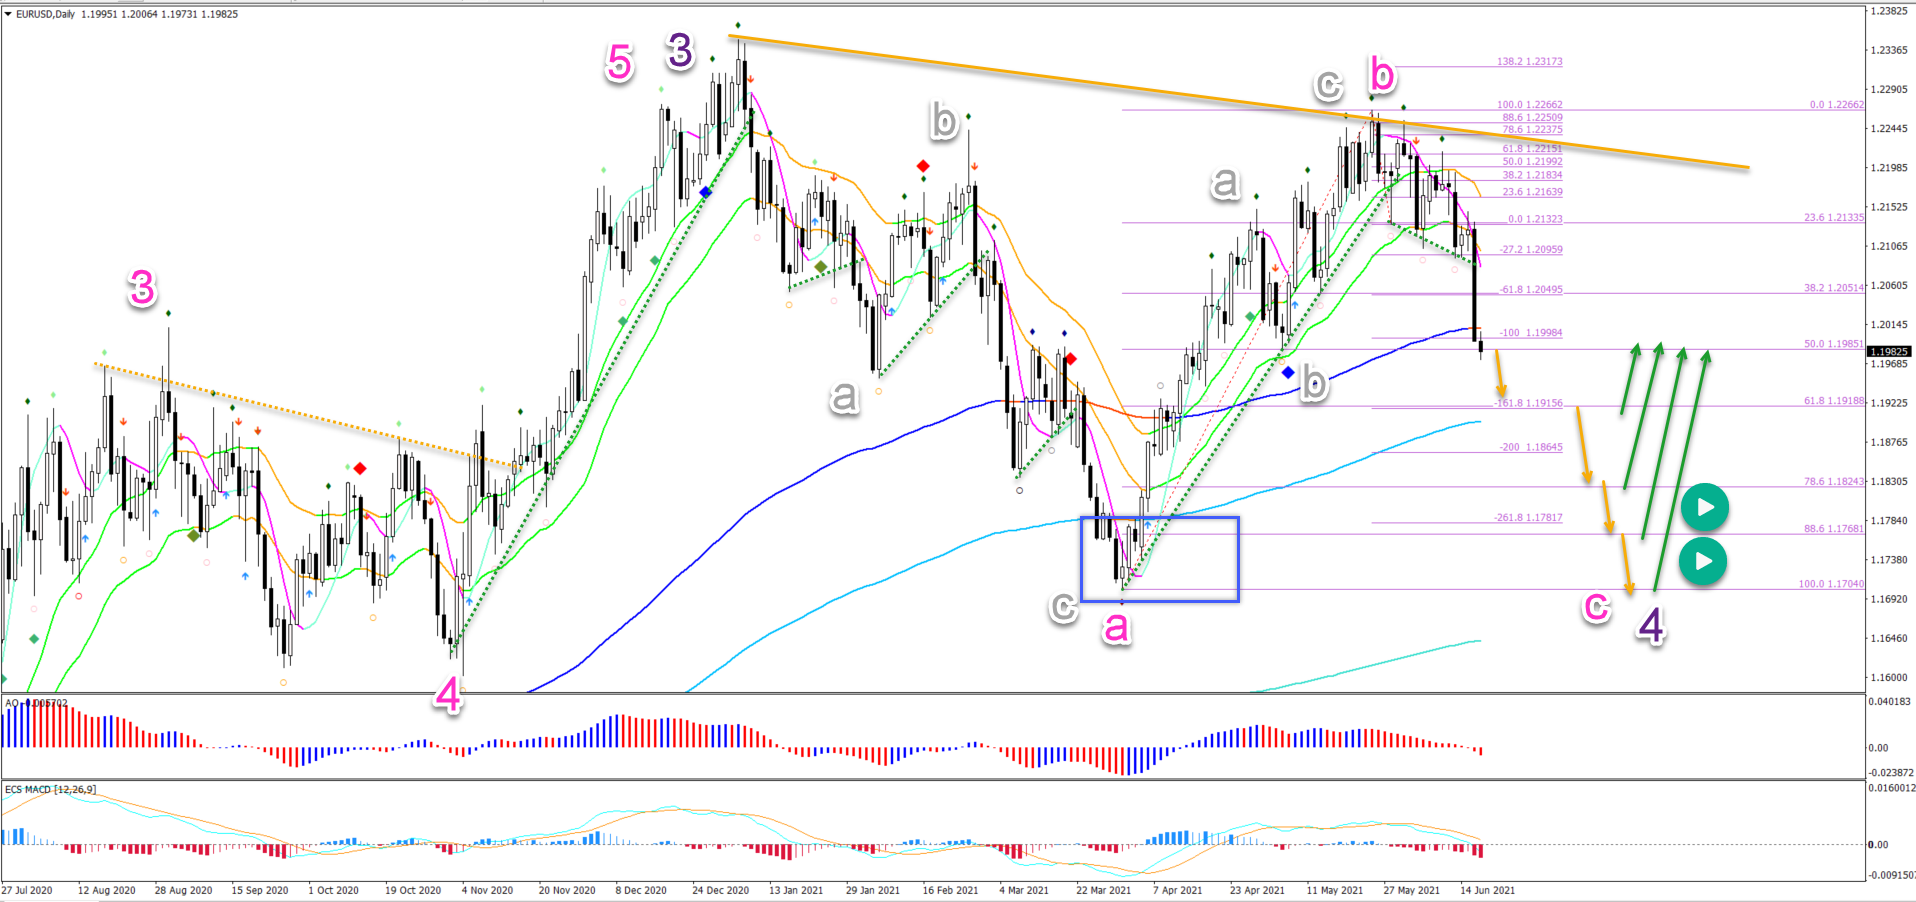
The EUR/USD has made the final bearish turn as expected. The bullish wave B (pink) is therefore complete and a bearish price swing is now developing:
- The bearish price swing is expected to be a wave C (pink) of a larger ABC (pink) in wave 4 (purple).
- The wave 4 (purple) remains valid as long as price action stays above 1.17 and at the very least 1.15.
- A break below the 1.15 support indicates that wave 4 (purple) is not likely anymore. In that case, price is not building an ABC (pink) but a bearish 123 pattern.
- All of the Fibonacci support levels could be support but the main reversal levels are the 88.6% Fib and the previous bottom (blue box).
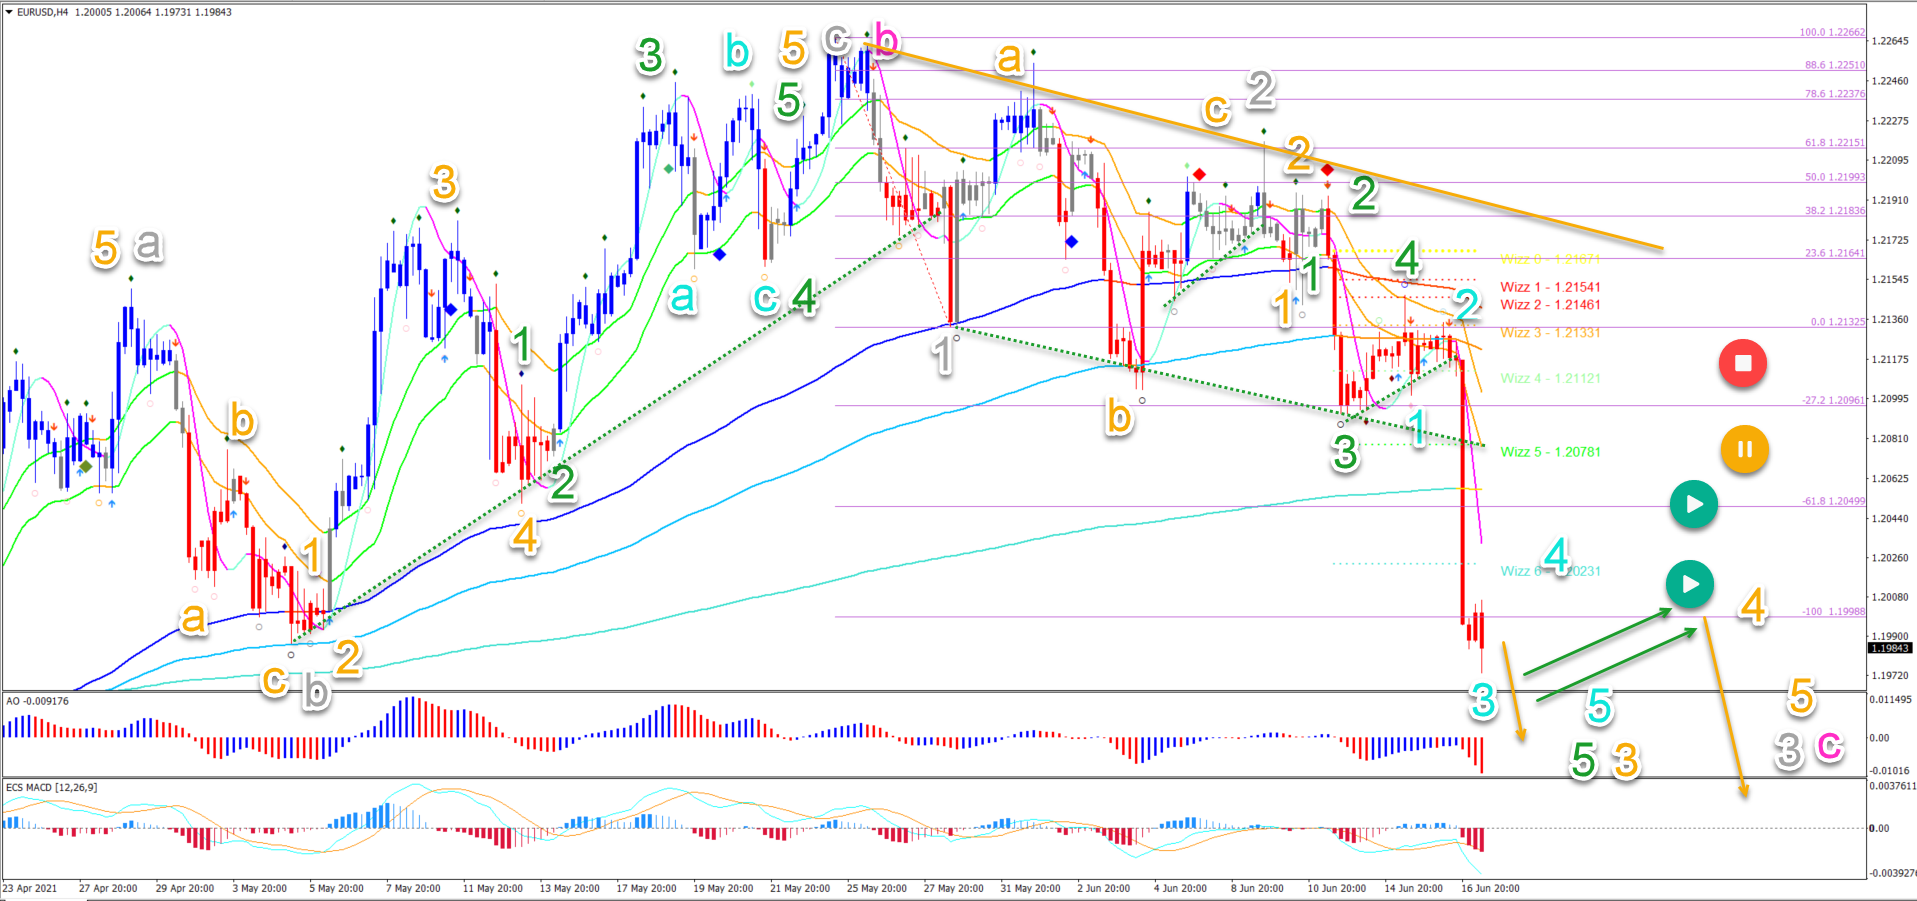
On the 4 hour chart, price action has broken the bottom (dotted green) of the downtrend channel:
- The bearish breakout below the support trend line (dotted green) and the 21 ema low helped confirm the bearish price swing.
- The strong bearish impulse is typical for a wave 3 (blue). The break below the -61.8% Fibonacci target helps confirm the wave 3 pattern rather than a wave C.
- The wave 3 (blue) is probably part of a larger wave 3 (orange) and wave 3 (grey).
- The main targets are the -1.618% FIb at 1.1915, the -2% Fib at 1.1865 and -2.618% Fib at 1.1782.
- Eventually a pullback to a shallow Fib should take place as part of a wave 4 retracement.


