
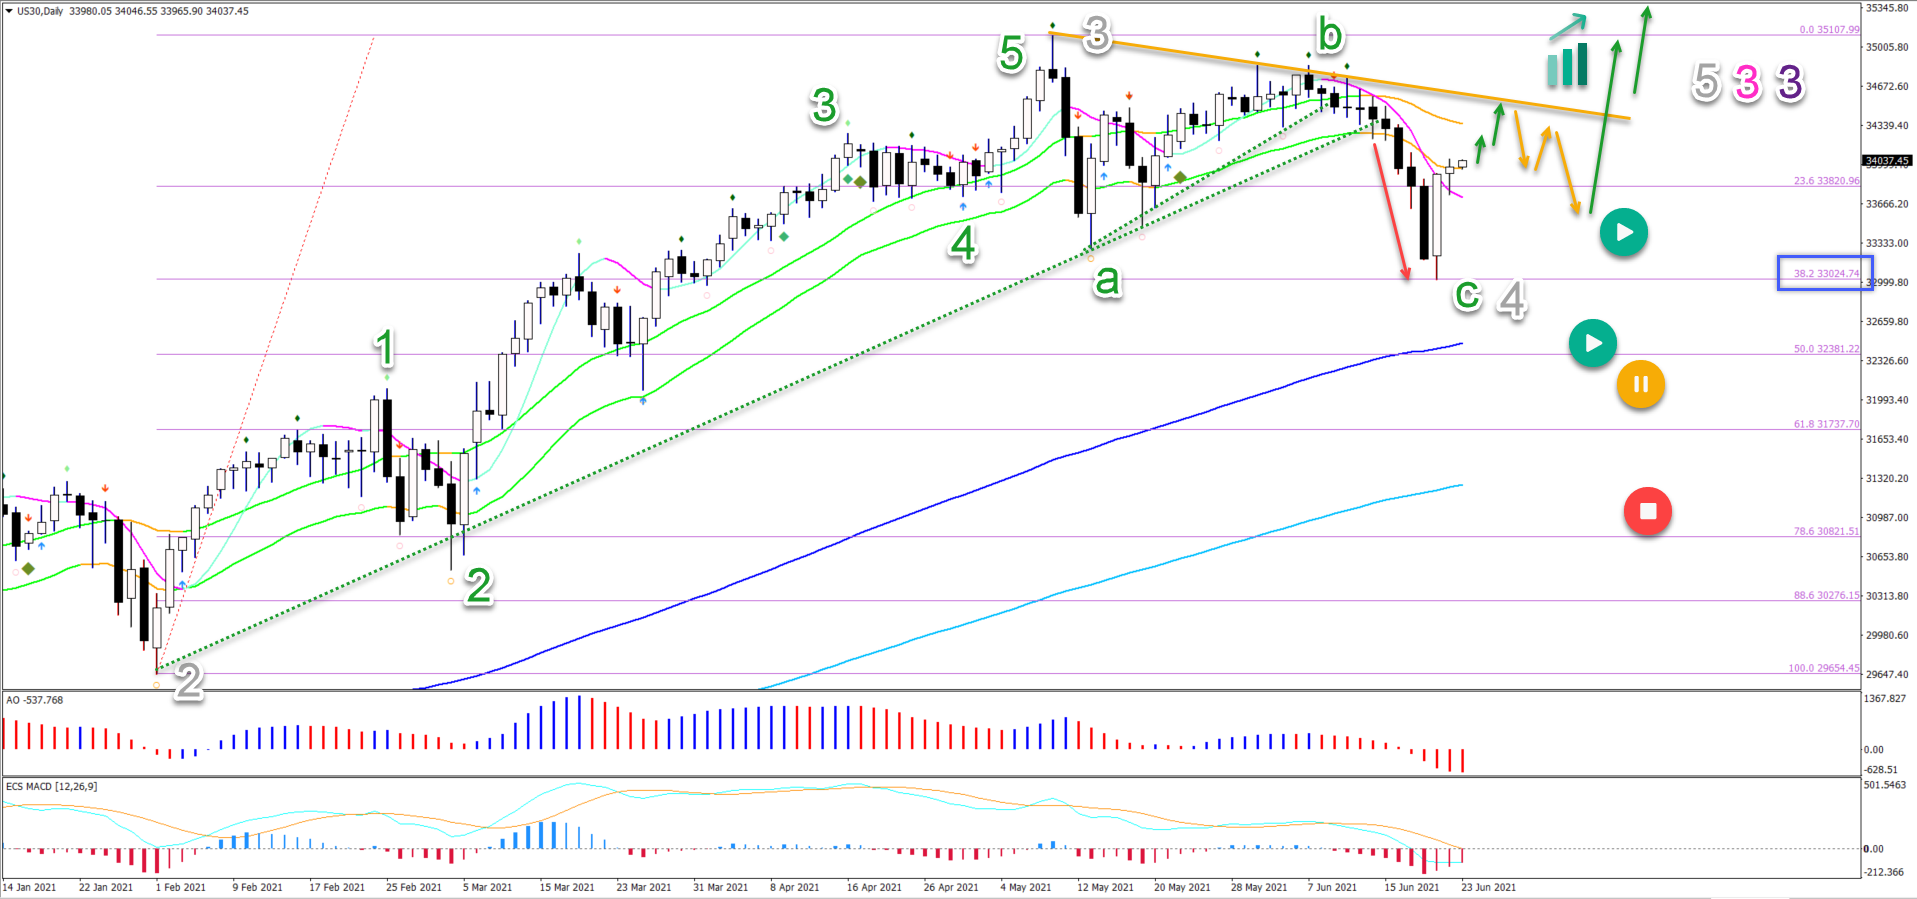
- US 30 (Dow Jones Index) daily chart made a bearish pullback and bullish bounce at the 38.2% Fib – as expected in our previous Elliott Wave analysis.
- A strong bullish engulfing twins daily candlestick pattern appeared at the 38.2% Fib. The main target is the -27.2% Fibonacci target at $36,573.
- A bearish ABC (green) seems to be completed and price action is now testing the 21 ema resistance zone.
Price charts and technical analysis
The Dow Jones Index (DJI) broke below (red arrow) the 21 ema low and support trend line (dotted green) for a bearish price swing and a wave C (green):
- The bearish price swing bounced at the 38.2% Fibonacci retracement level (blue box), which is typical for a wave 4 (grey) pattern.
- A strong bullish engulfing twins daily candlestick pattern appeared at the 38.2% Fib.
- A bearish ABC (green) seems to be completed and price action is now testing the 21 ema resistance zone.
- A bullish breakout above the resistance trend line (orange) could confirm the uptrend.
- A bullish bounce at the 50% is still usual for a wave 4 but a pullback (orange circle) below the 50% Fib places it hold and a deep retracement invalidates it (red circle).
- The main target is the -27.2% Fibonacci target at $36,573.
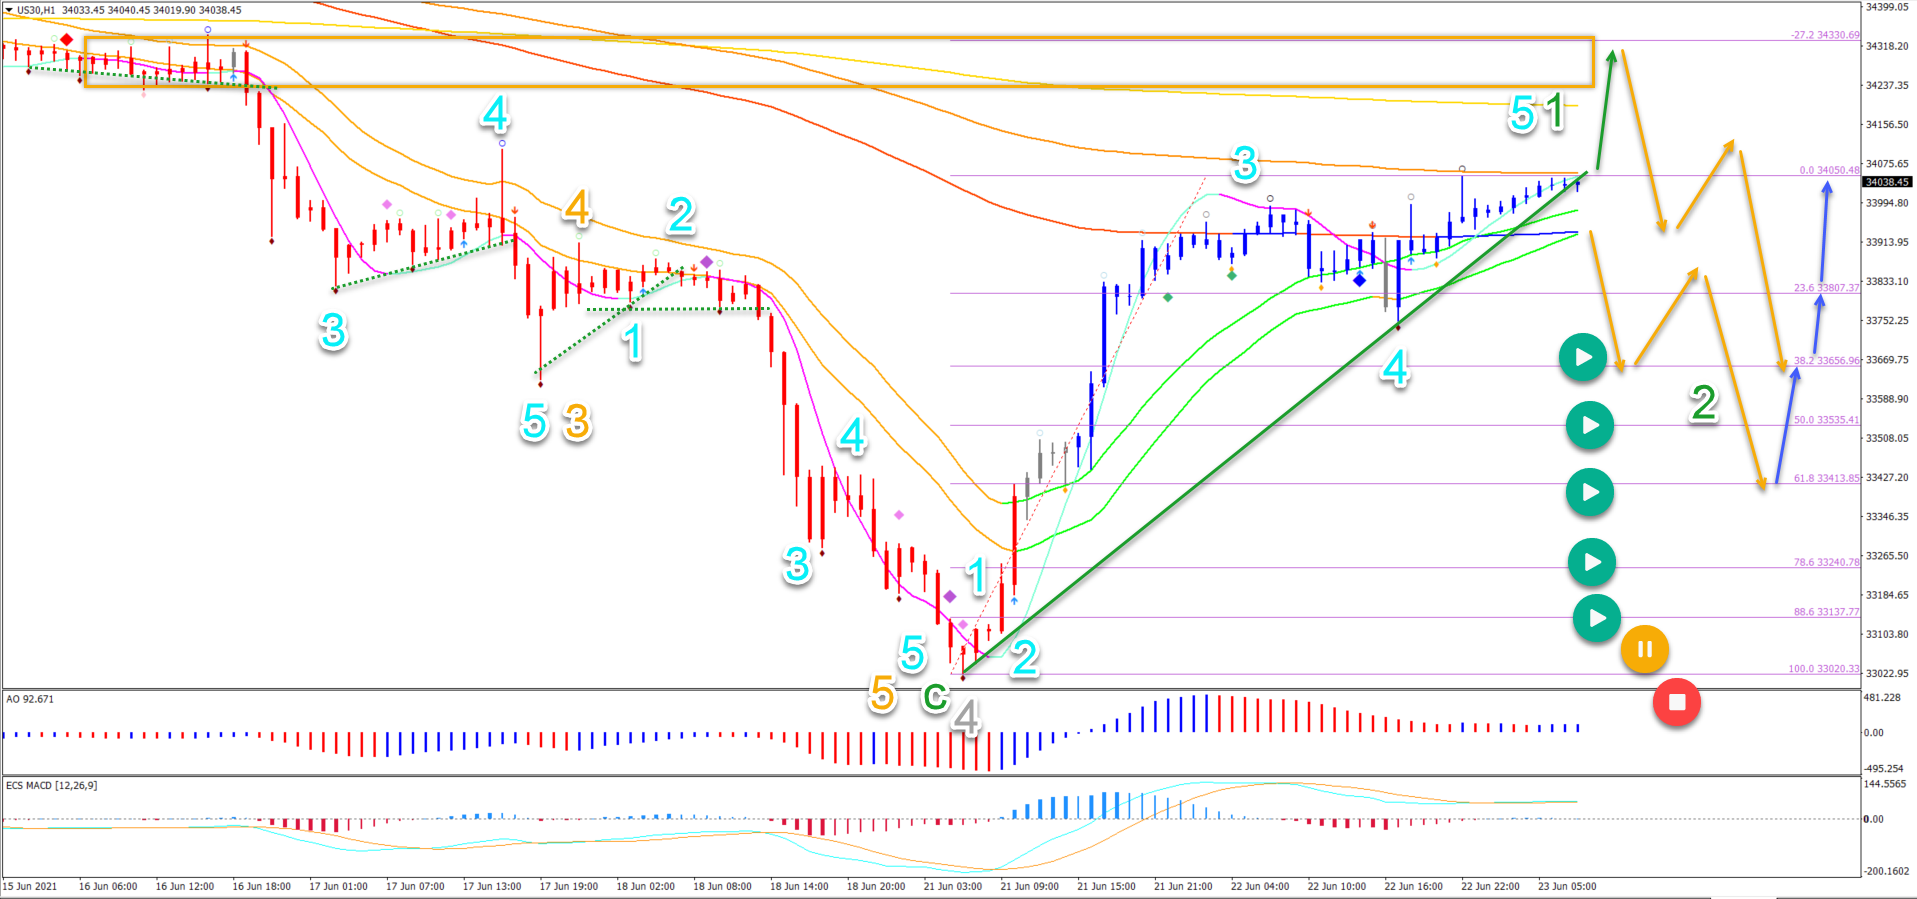
On the 1 hour chart, price action completed a bearish 5 waves (blue) in wave 5 (orange) of wave C (green):
- Now price action seems to be building 5 bullish waves (blue) in wave 1 (green).
- A bearish break (orange arrows) below the 21 ema low could confirm a bearish ABC in wave 2 (green).
- A bullish break (green arrows) could see price action test the resistance zone (orange box).
- A bullish bounce is expected (blue arrows) at any of the Fibonacci support levels within wave 2 (green).


 Favors Upside")


