
Technical analysis
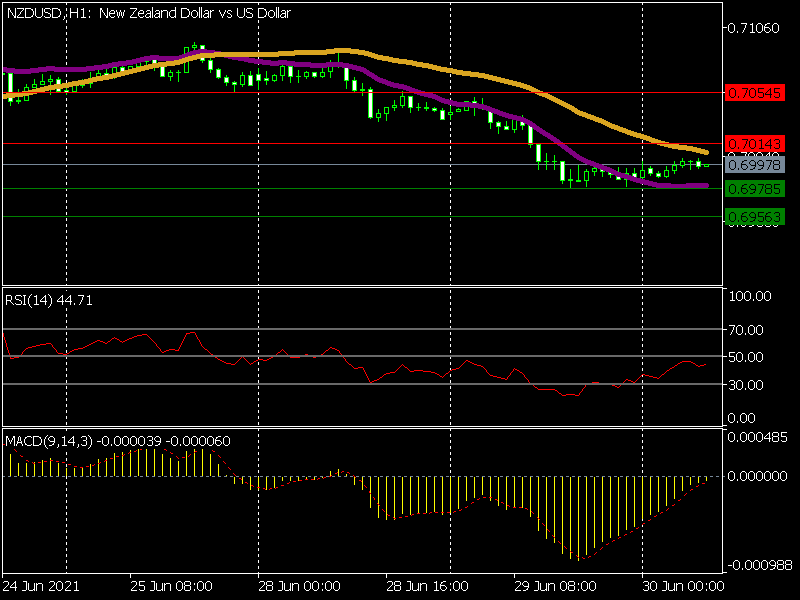
The price lies between EMA(50) and EMA(100)
The EMA(100) is higher EMA(50), which is favourable for bears
The MACD is below 0, with the signal line pointing up
The RSI is below 50, which predicts a decline.
What the possible outcomes are
The currency pair fell to a new weekly low yesterday and now consolidates at the psychological level of 0.7000. As the U.S. dollar index remains high, NZDUSD looks bearish on the one-hour chart.
At the moment, the price may decline toward the first support level of 0.69785. Beneath lies the second support level of 0.69563.
If bulls defend the support level of 0.69785, the price may reverse towards the resistance level of 0.70143. A breakout of that level can push the price higher towards 0.70545.
Key levels
Support 0.69785 0.69563
Resistance 0.70143 0.70545


