
Technical analysis
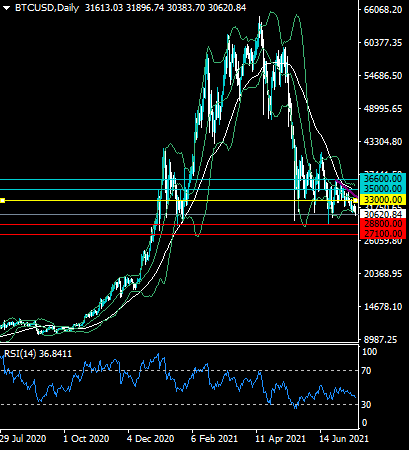
The RSI is under line 50, indicating that selling pressure and the overall downtrend is still in play.
The BTCUSD pair is testing its lower Bollinger Band on the daily time frame. Sustained weakness under the lower Bollinger Band will generate a sell signal.
What the possible outcomes are
In our most likely scenario, BTCUSD starts to hold below the lower Bollinger Band on the daily time frame on a sustained basis and then delcines towards the $28,880 level, or possibly the $27,100 level.
Alternatively, the BTCUSD pair may hold above the lower Bollinger Band on the daily time frame, and then start to attract buying interest. BTCUSD may then rebound towards the $33,000 resistance lower.
Key levels
Support $28,800 $27,100
Resistance $33,000 $35,000


