
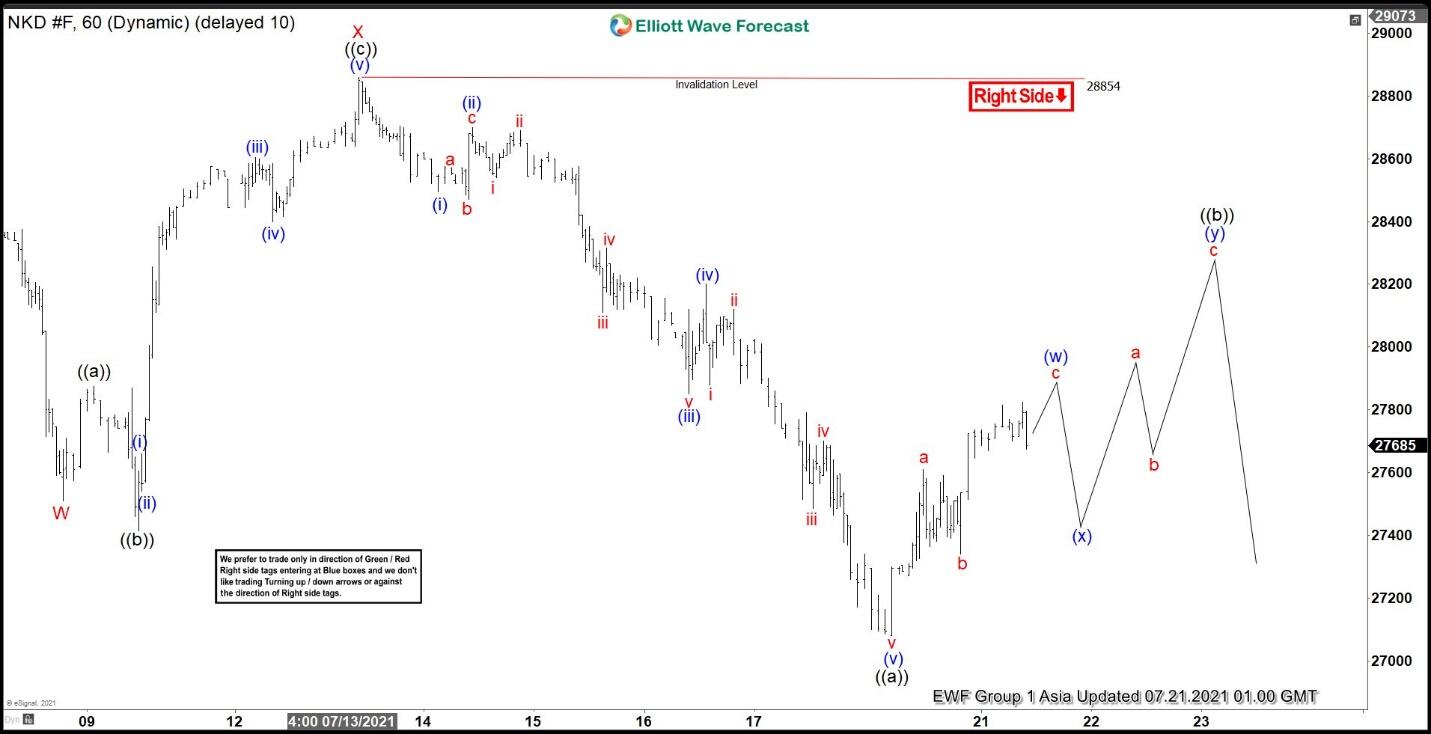
Elliott Wave structure of Nikkei (NKD) shows incomplete sequence from February 16, 2021 high as well as from June 15, 2021 high suggesting further downside is likely. From June 15 peak, the Index shows a 5 swing sequence which is an incomplete sequence that needs further downside. The decline from June 15 is unfolding as a double three Elliott Wave structure. Down from June 15, wave W ended at 27510 and rally in wave X ended at 28860. Internal subdivision of wave X unfolded as an Expanded Flat where wave ((a)) ended at 27875, wave ((b)) ended at 27415, and wave ((c)) ended at 28860.
The Index has resumed lower in wave Y as a zigzag Elliott Wave structure. Down from wave X, wave (i) ended at 28495, and rally in wave (ii) ended at 28700. The Index resumes lower in wave (iii) towards 27850 and bounce in wave (iv) ended at 28200. Final leg lower wave (v) ended at 27080 which should complete wave ((a)) in higher degree. Bounce in wave ((b)) is in progress to correct cycle from July 13 peak before the decline resumes. Near term, as far as July 13 pivot high at 28854 stays intact in the first degree, expect rally to fail in 3, 7, or 11 swing for more downside.
Nikkei 60 Minutes Elliott Wave Chart


