
Technical analysis
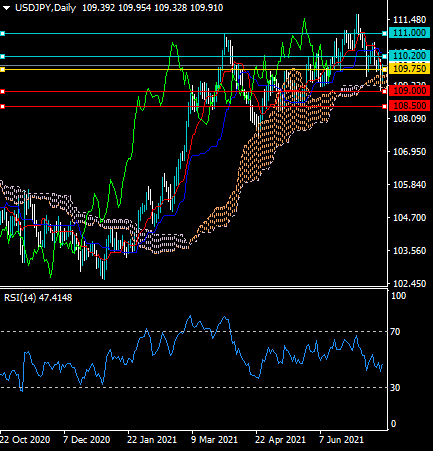
The daily time frame shows that the USDJPY pair recently found technical support and strong dip-buying from the Ichimoku.
The RSI indicator on the four-hour time frame is heavily bearish and continues to create lower highs, meaning that sellers are still in control in the short-term horizon.
What the possible outcomes are
In our most likely scenario, the USDJPY pair will continue to head higher over the mid-term as the bearish head and shoulders pattern has recently been invalidated on the daily time frame.
Alternatively, the USDJPY pair may start to consolidate around the current trading level and then stage another downward move back towards the 109.00 support level.
Key levels
Support 109.00 108.50
Resistance 110.20 111.00


