
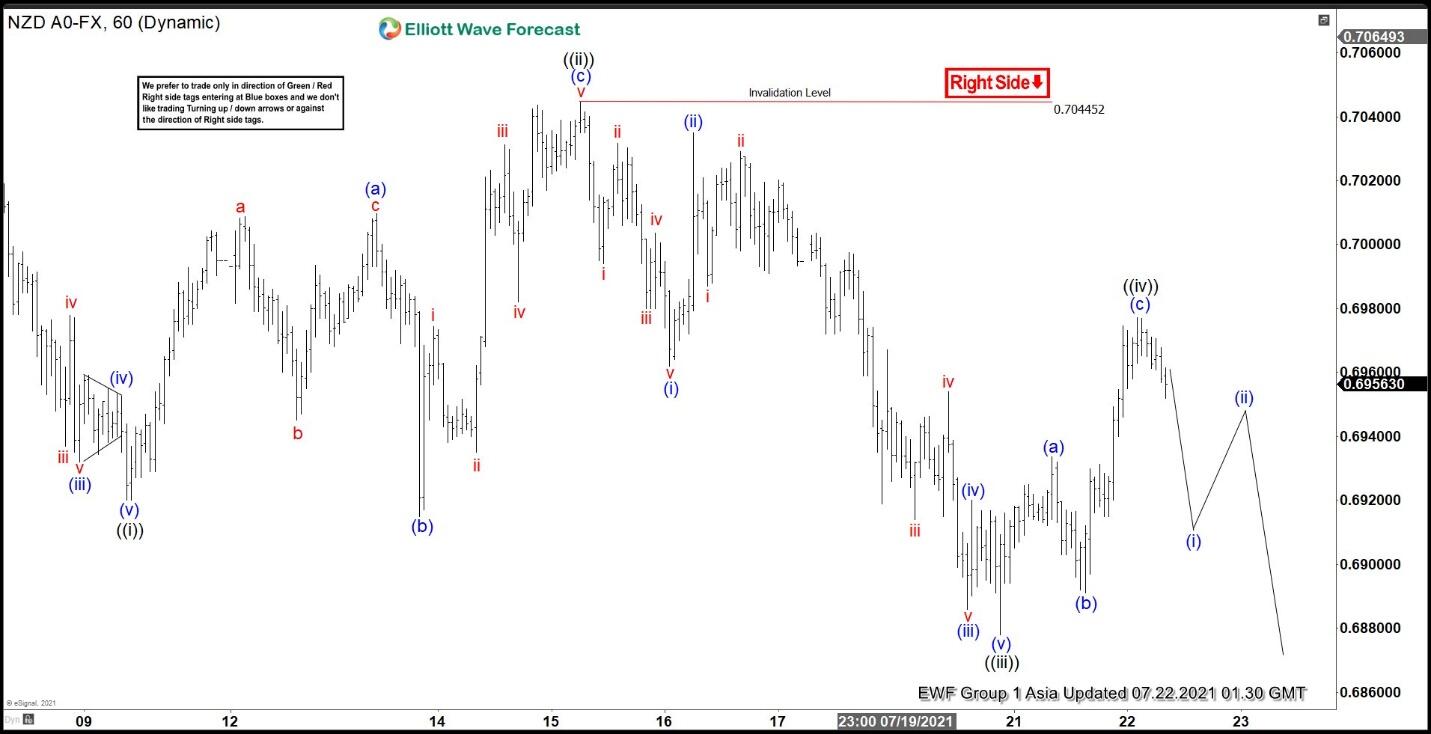
$NZDUSD shows incomplete bearish sequence from February 26, 2021 peak favoring further downside. A 100% – 161.8% Fibonacci extension from February 26 peak can see the pair reaching 0.646 – 0.679 area where support can be seen for 3 waves rally at least. Near term decline from July 6 peak is currently unfolding as a leading diagonal Elliott Wave structure. Down from July 6 peak, wave ((i)) ended at 0.692 and rally in wave ((ii)) ended at 0.7044. Pair resumes lower in wave ((iii)) towards 0.6878 with internal subdivision as a 5 waves impulse. Down from wave ((ii)), wave (i) ended at 0.696, and rally in wave (ii) ended at 0.7034. Pair then resumes lower in wave (iii) towards 0.6886 and bounce in wave (iv) ended at 0.692. Final leg lower in wave (v) ended at 0.6878 which should end wave ((iii)) in larger degree.
Bounce in wave ((iv)) is proposed complete at 0.6977 as a zigzag Elliott Wave structure. Wave (a) ended at 0.693, wave (b) ended at 0.689, and wave (c) ended at 0.6977. Expect pair to extend lower in wave ((v)) to end cycle from July 6 peak as 5 waves diagonal, then it should rally in 3 waves to correct that decline before it resumes lower again. Near term, as far as July 15 pivot high at 0.7044 remains intact, expect rally to fail in 3, 7, or 11 swing for more downside.
NZDUSD 60 Minutes Elliott Wave Chart


