
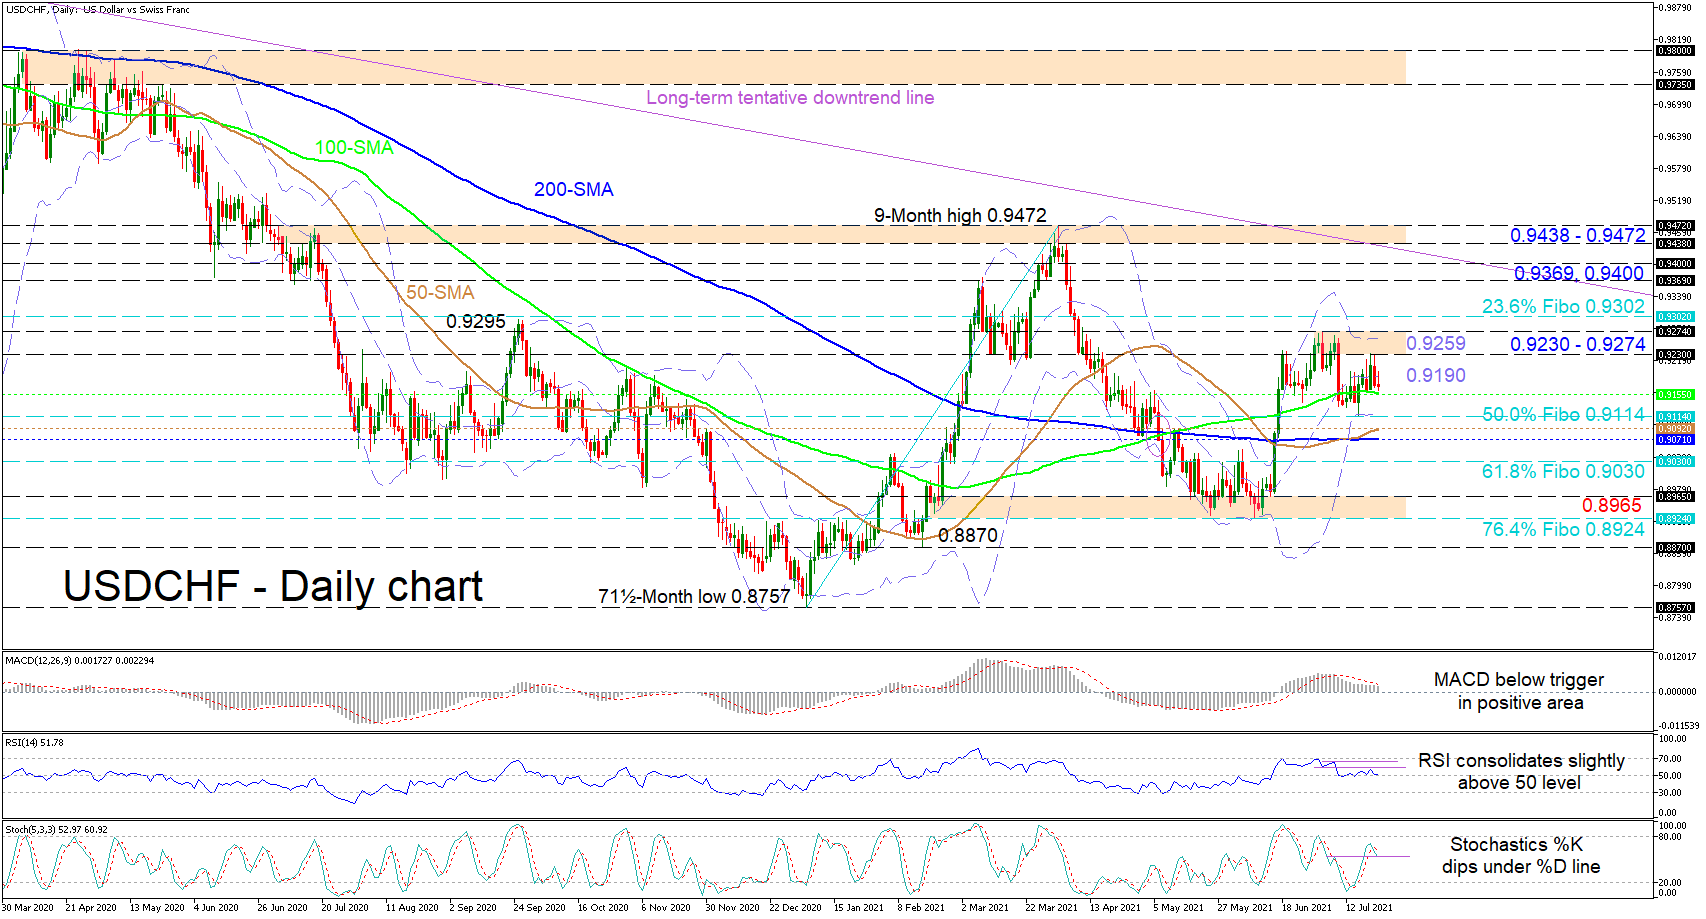
USDCHF is struggling to dip beneath the 100-day simple moving average (SMA) at 0.9155 following the recent evaporation of upside momentum. That said, the pair is somewhat presently stuck between the stabilized upper and lower frontiers of the Bollinger bands at 0.9259 and 0.9114 respectively. The SMAs at this point in time are not really signalling a definitive price direction.
The short-term oscillators are suggesting a slight increase in negative momentum. The MACD, in the positive area, is holding below its red trigger line, while the RSI is tiptoeing across the 50 level, looking inclined to dip beneath it. That said the negatively charged stochastic oscillator is promoting downside price action.
If sellers drive the price below the 100-day SMA at 0.9155, preliminary tough support could develop at the lower Bollinger band at 0.9114, which happens to also be the 50.0% Fibonacci retracement of the up leg from 0.8757 to 0.9472. Hovering beneath this level is a support band formed between the 50- and the 200-day SMAs at 0.9092 and 0.9071 respectively. If sellers decisively take the lead, the 61.8% Fibo of 0.9030 could be challenged before the hardened floor from the 0.8965 low until the 76.4% Fibo of 0.8924 comes into play.
Otherwise, if the pair oversteps the mid-Bollinger band at 0.9190, buyers may encounter a durable resistance section of 0.9230-0.9274. Climbing above the upper Bollinger band, the 23.6% Fibo at 0.9302 could impede the price from jumping to test the 0.9369 and 0.9400 barriers. From here, only a thrust above the long-term restrictive line, pulled from the 1.0235 peak, and beyond the resistance region of 0.9438-0.9472 could strengthen the bullish outlook.
Summarizing, USDCHF is sustaining a neutral demeanour squeezed between the Bollinger bands. An initial break either above the upper or lower Bollinger band at 0.9259 or 0.9114 respectively could boost a price direction in the near-term.


