
Technical analysis
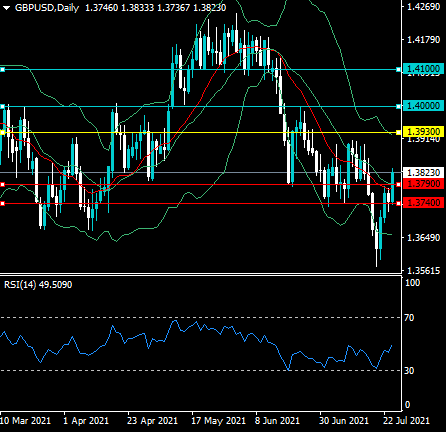
The GBPUSD pair has broken above the mid-line of the daily Bollinger Band and could start to target the upper Bollinger Band, around the 1.3930 resistance level.
Bullish MACD price divergence extends until the 1.4000 resistance level, while the daily RSI indicator is rising and is close to crossing above the 50 reading needed for a buy signal.
What the possible outcomes are
In our most likely scenario, the GBPUSD pair will rally towards the 1.3930 and 1.4000 level over the medium-term before a correction takes place..
Alternatively, the GBPUSD pair corrects back towards the mid-line on the Bollinger Band indicator, around the 1.3790 support region before rally again.
Key levels
Support 1.3790 1.3740
Resistance 1.3930 1.4000


