
Technical analysis
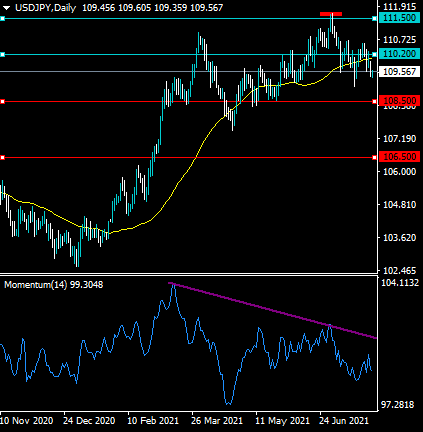
The daily time frame shows that the USDJPY pair is trading under the neckline of a large head and shoulders pattern, which is pointing to more heavy losses.
The Momentum indicator on the daily time frame shows that substantial amount of bearish divergence has formed, and extends down to the 106.50 level.
What the possible outcomes are
In our most likely scenario, the USDJPY pair will continue to head lower over the mid-term as the bearish head and shoulders pattern continues to play out on the daily time frame.
Alternatively, the USDJPY pair may start to consolidate between the 109.00 and 110.00 levels and then test back towards the yearly high, around the 111.50 resistance area.
Key levels
Support 108.50 106.50
Resistance 110.20 111.50


