
Technical analysis
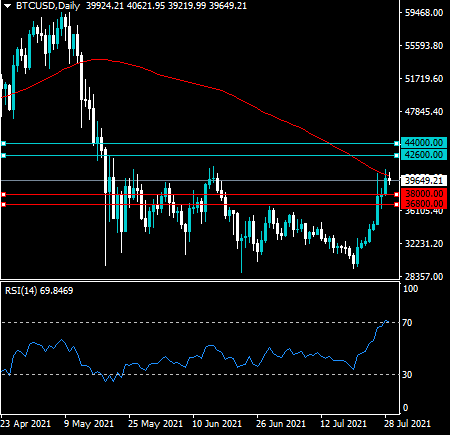
The daily time frame shows that the BTCUSD pair is trading above its key 50-day moving average and attempting to break its 100-day moving average.
The RSI indicator is approaching overbought territory across the daily time frame, however it is noteworthy that the RSI is not yet extremely overbought.
What the possible outcomes are
In our most likely scenario, the BTCUSD pair starts to breakout towards its trend defining 200-day moving average, around the $44,000 price area.
Alternatively, the BTCUSD pair will drop back towards the $38,000 support area and then starts to rally towards its 200-day moving average.
Key levels
Support $39,000 $38,000
Resistance $42,600 $44,000


 Buying the Dips After Elliott Wave Double Three")
