
The EUR/USD currency pair
Technical indicators of the currency pair:
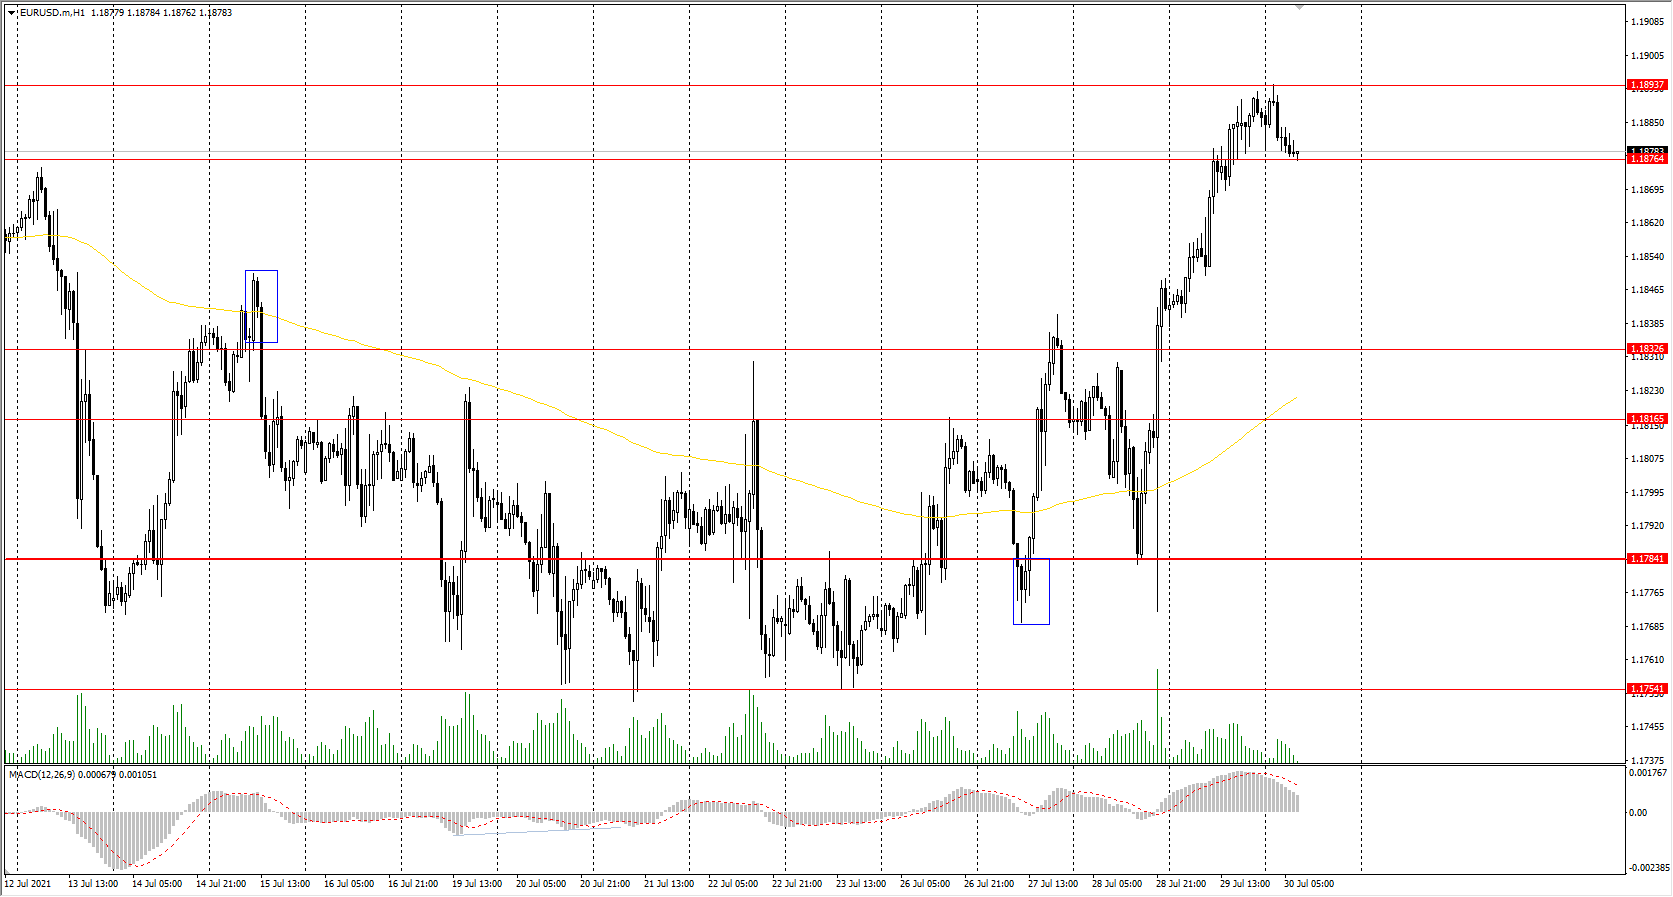
Prev Open: 1.1842
Prev Close: 1.1886
% chg. over the last day: +0.37%
As the dollar index fell, the European currency strengthened by 0.37%, despite the rising inflation in Germany to 3.8% in July, the highest level since 2008. The rise in inflation is primarily triggered by higher energy prices and a reduction in VAT (Valued Added Tax), which Angela Merkel’s government had introduced to mitigate the effects of the pandemic. At the same time, Germany’s unemployment rate decreased to 5.7% (from 5.9%).
Trading recommendations
Support levels: 1.1876, 1.1833, 1.1817, 1.1784, 1.1754, 1.1609
Resistance levels: 1.1894, 1.1934, 1.1969
From the technical point of view, the general trend of the EURUSD currency pair has changed to bullish as the price broke through the priority change level. The price is trading above the moving average; the MACD indicator is in the positive zone with no signs of divergence. Under such market conditions, it is best to trade intraday. Buy positions should be considered only after a pullback to the support level, as the price has strongly deviated from the moving average. Sell deals should be considered from the resistance levels, but that would be trading against the mid-term trend.
Alternative scenario: if the price breaks down through the 1.1784 support level and fixes below, the mid-term uptrend is likely to be broke
News feed for 2021.07.30:
- Germany GDP (q/q) at 11:00 (GMT+3);
- Eurozone Consumer Price Index (m/m) at 12:00 (GMT+3);
- Eurozone GDP (q/q) at 12:00 (GMT+3);
- Eurozone Unemployment Rate (m/m) at 12:00 (GMT+3);
- US PCE price index (m/m) at 15:30 (GMT+3);
- US Chicago PMI (m/m) at 16:45 (GMT+3).
The GBP/USD currency pair
Technical indicators of the currency pair:
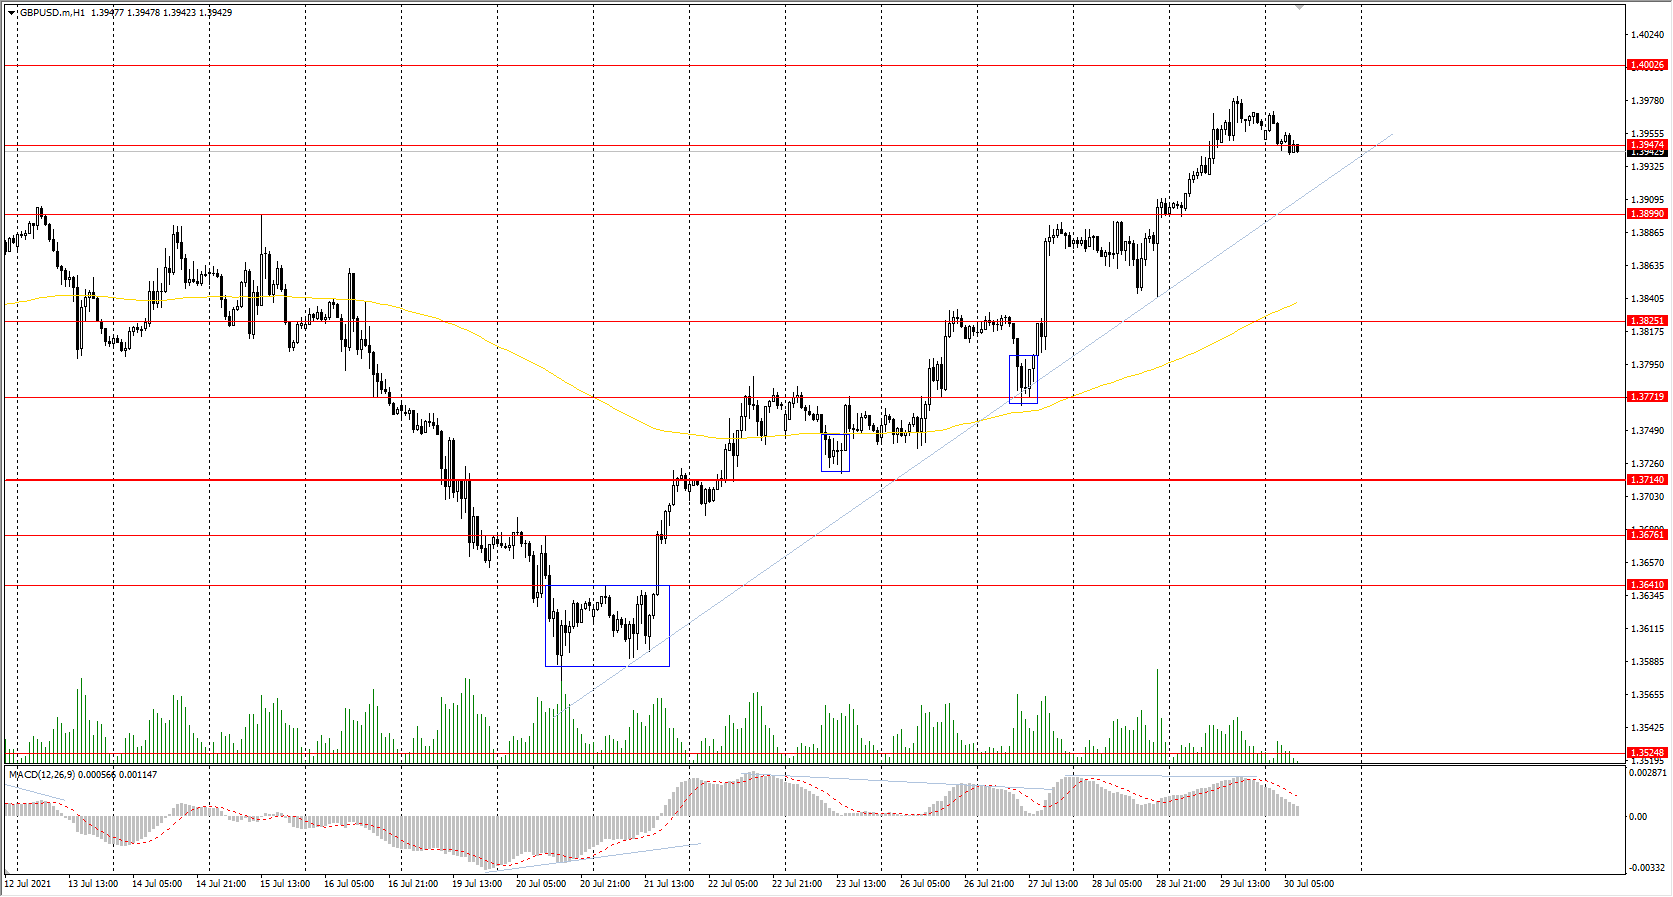
Prev Open: 1.3900
Prev Close: 1.3961
% chg. over the last day: +0.43%
Against the background of the dollar index fall, the British pound gained another 0.43%. According to the International Monetary Fund (IMF) report, the UK economy will recover the fastest among all European countries. It should be noted, though, that the UK has suffered most of the coronavirus epidemic among the G7 countries.
Trading recommendations
Support levels: 1.3900, 1.3825, 1.3772, 1.3714, 1.3676 ,1.3641, 1.3614, 1.3525
Resistance levels: 1.3947, 1.4002, 1.4075, 1.4101
The GBP/USD currency pair trend is bullish on the H1 timeframe. The MACD indicator is in the positive zone but with signs of divergence. Under such market conditions, traders are better to look for buy positions after the price pulls back to the support level. There are no optimal points for sell positions right now. Traders can search for intraday sell entries from the resistance level with short targets, but they should understand that it will be trading against the main trend.
Alternative scenario: if the price breaks down through the 1.3714 support level and consolidates below, the bearish scenario is likely to resume.
The USD/JPY currency pair
Technical indicators of the currency pair:
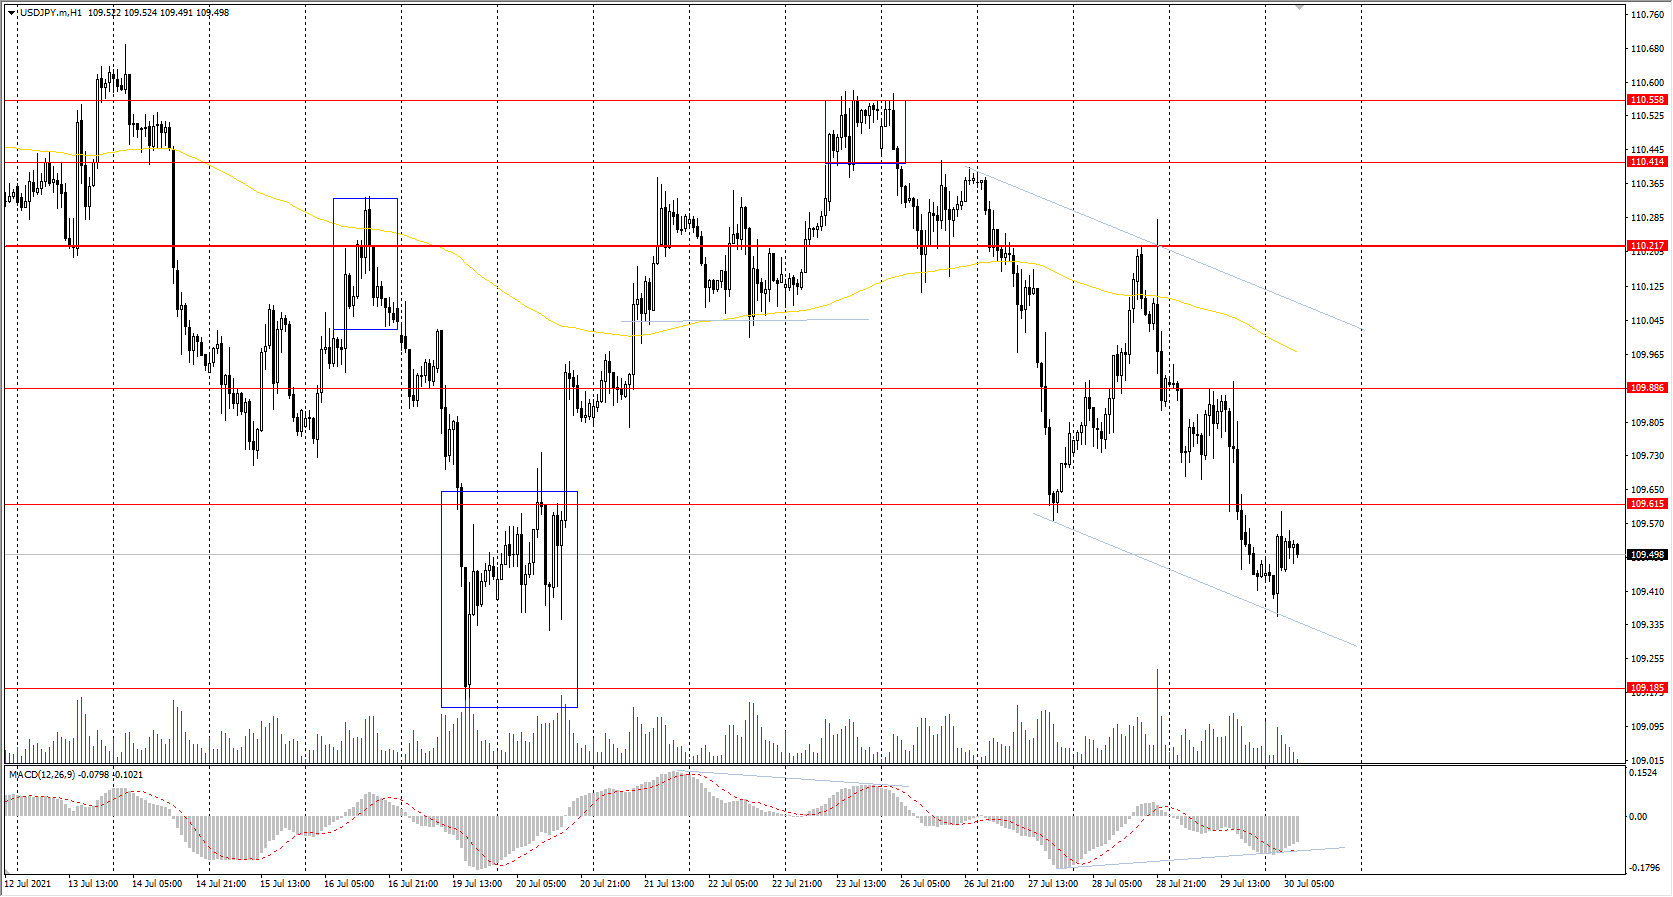
Prev Open: 109.86
Prev Close: 109.48
% chg. over the last day: -0.35%
The USD/JPY currency pair decreased by 0.35% amid the background of the dollar index fall, breaking through the priority change level. Japan’s unemployment rate decreased to 2.9% (previous 3.0%), while the job availability ratio increased (113 job openings for every 100 job seekers). Japan’s economy is now slowly but surely recovering, which also adds strength to the national currency.
Trading recommendations
Support levels: 109.19, 108.65
Resistance levels: 109.61, 109.88, 110.22, 110.41, 110.56
The main trend of the USD/JPY currency pair has changed to bullish again. The price is trading below the moving average, with the MACD indicator in the oversold zone with signs of divergence. Under such market conditions, it is best to look for sell positions from the resistance levels, but after a small pullback, as the price has strongly deviated from the moving average. Buy positions can be considered only intraday and only with short targets.
Alternative scenario: if the price rises above 110.22, the uptrend is likely to be resumed.
News feed for 2021.07.30:
- Japan Unemployment Rate (m/m) at 02:30 (GMT+3).
The USD/CAD currency pair
Technical indicators of the currency pair:
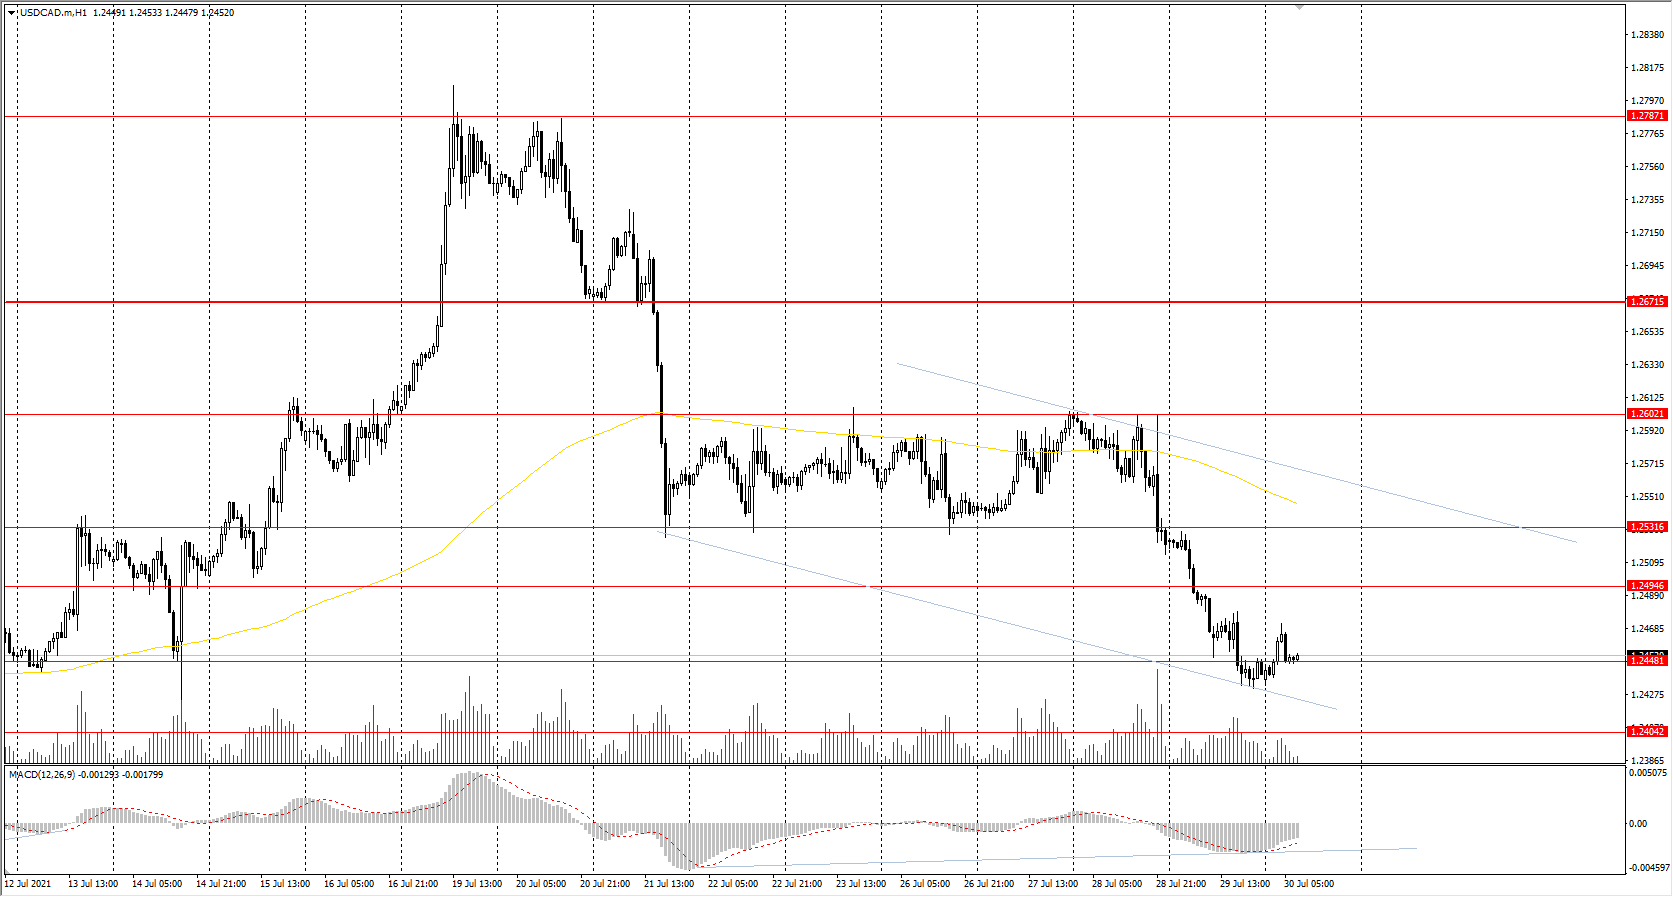
Prev Open: 1.2523
Prev Close: 1.2440
% chg. over the last day: -0.67%
Against the background of rising oil prices, and taking into account the fall of the dollar index, the Canadian dollar futures strengthened sharply yesterday, which led to a drop in USD/CAD quotes (inverse correlation). The economic situation in Canada looks better than in the US as Canada has seen a slowdown in inflation and improving labor market indicators.
Trading recommendations
Support levels: 1.2448, 1.2404, 1.2347, 1.2312
Resistance levels: 1.2495, 1.2531, 1.2602, 1.2671, 1.2787, 1,2951
From the point of view of technical analysis, the USD/CAD trend is bearish. The MACD indicator is in the negative zone, but there are the first signs of divergence on the higher timeframe. Under such market conditions, it is best for traders to look for sell positions from the resistance levels after a small pullback. Buy positions can be considered only intraday and only with short targets.
Alternative scenario: if the price breaks out through the 1.2671 resistance level and fixes above, the uptrend is likely to be resumed.
News feed for 2021.07.30:
- Canada GDP (m/m, q/q) at 15:30 (GMT+3).


