
The EUR/USD currency pair
Technical indicators of the currency pair:
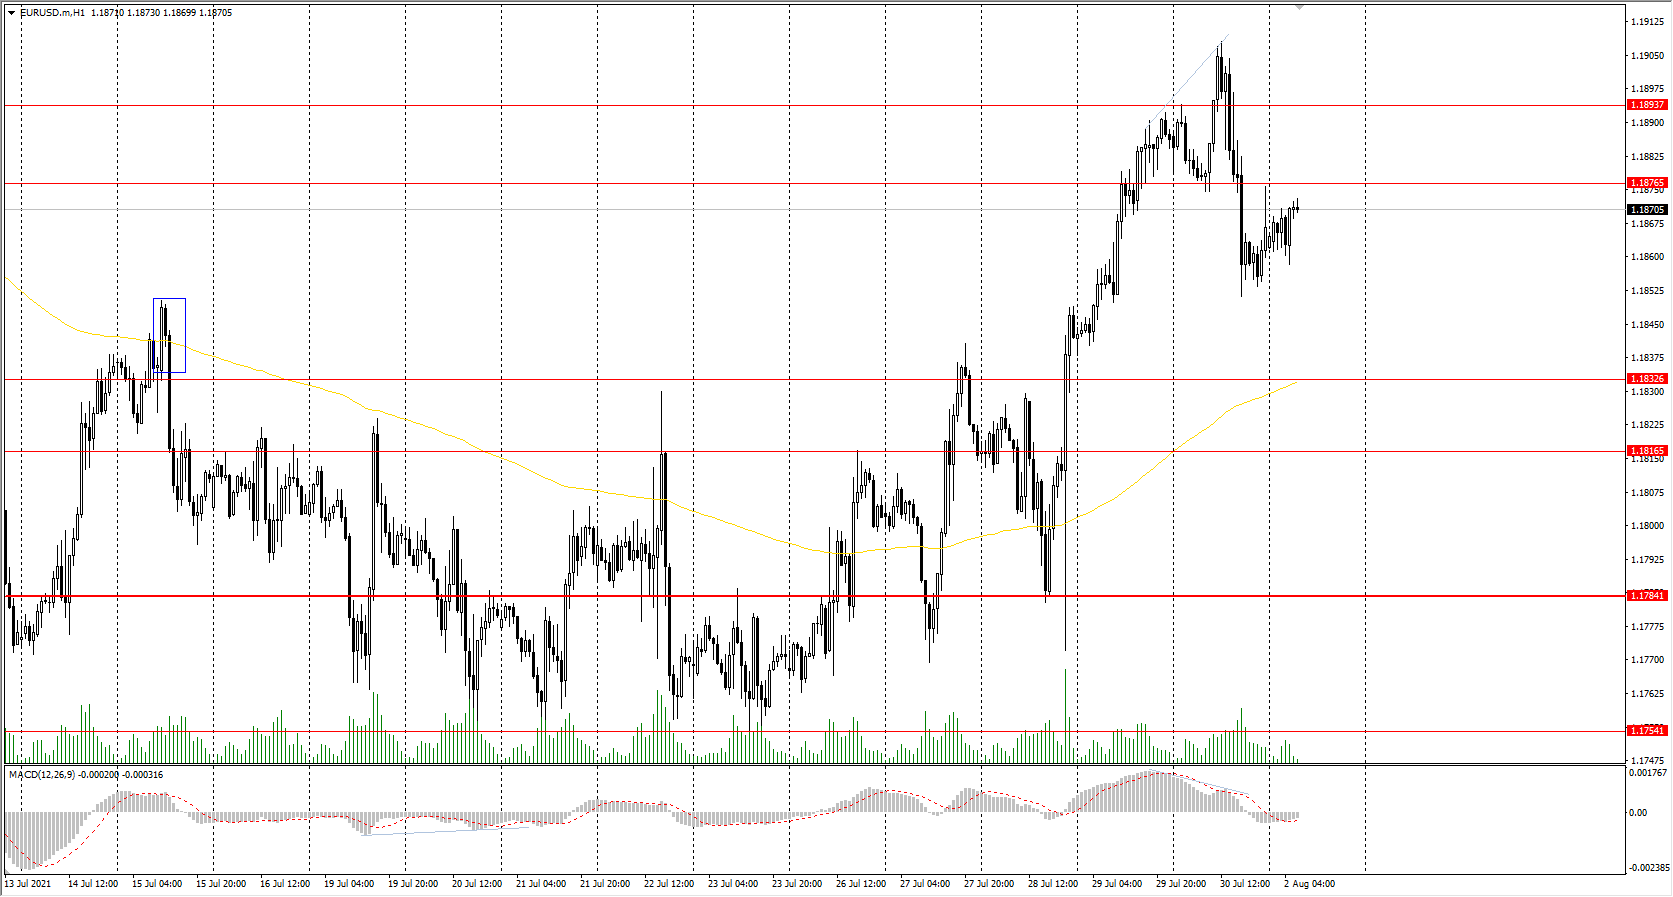
Prev Open: 1.1887
Prev Close: 1.1867
% chg. over the last day: -0.17%
Europe’s inflation rate increased to 2.2% in annual terms (previous 1.9%, ECB’s target 2.0%), but second-quarter GDP and unemployment data were better than economists’ expectations. The rise in annual inflation is mainly triggered by higher energy prices. The EU unemployment rate decreased from 8% to 7.7%, while GDP added 1.9%. Eurostat said the GDP growth was mainly due to the progress of COVID-19 vaccination and the gradual lifting of restrictions in many countries.
Trading recommendations
Support levels: 1.1833, 1.1817, 1.1784, 1.1754, 1.1609
Resistance levels: 1.1876, 1.1894, 1.1934, 1.1969
From the technical point of view, the general trend of the EUR/USD currency pair has changed to bullish, but the price slightly corrected lower on Friday. The price is trading above the moving average; the MACD indicator has become inactive. Under such market conditions, it is best to trade intraday. Buy positions should be considered only after a pullback to the support level. Sell deals should be considered from the resistance levels, but only with short targets.
Alternative scenario: if the price breaks down through the 1.1784 support level and fixes below, the mid-term uptrend is likely to be broken.
News feed for 2021.08.02:
- German Manufacturing PMI (m/m) at 10:55 (GMT+3);
- Eurozone Manufacturing PMI (m/m) at 11:00 (GMT+3);
- US ISM Manufacturing PMI (m/m) at 17:00 (GMT+3).
The GBP/USD currency pair
Technical indicators of the currency pair:
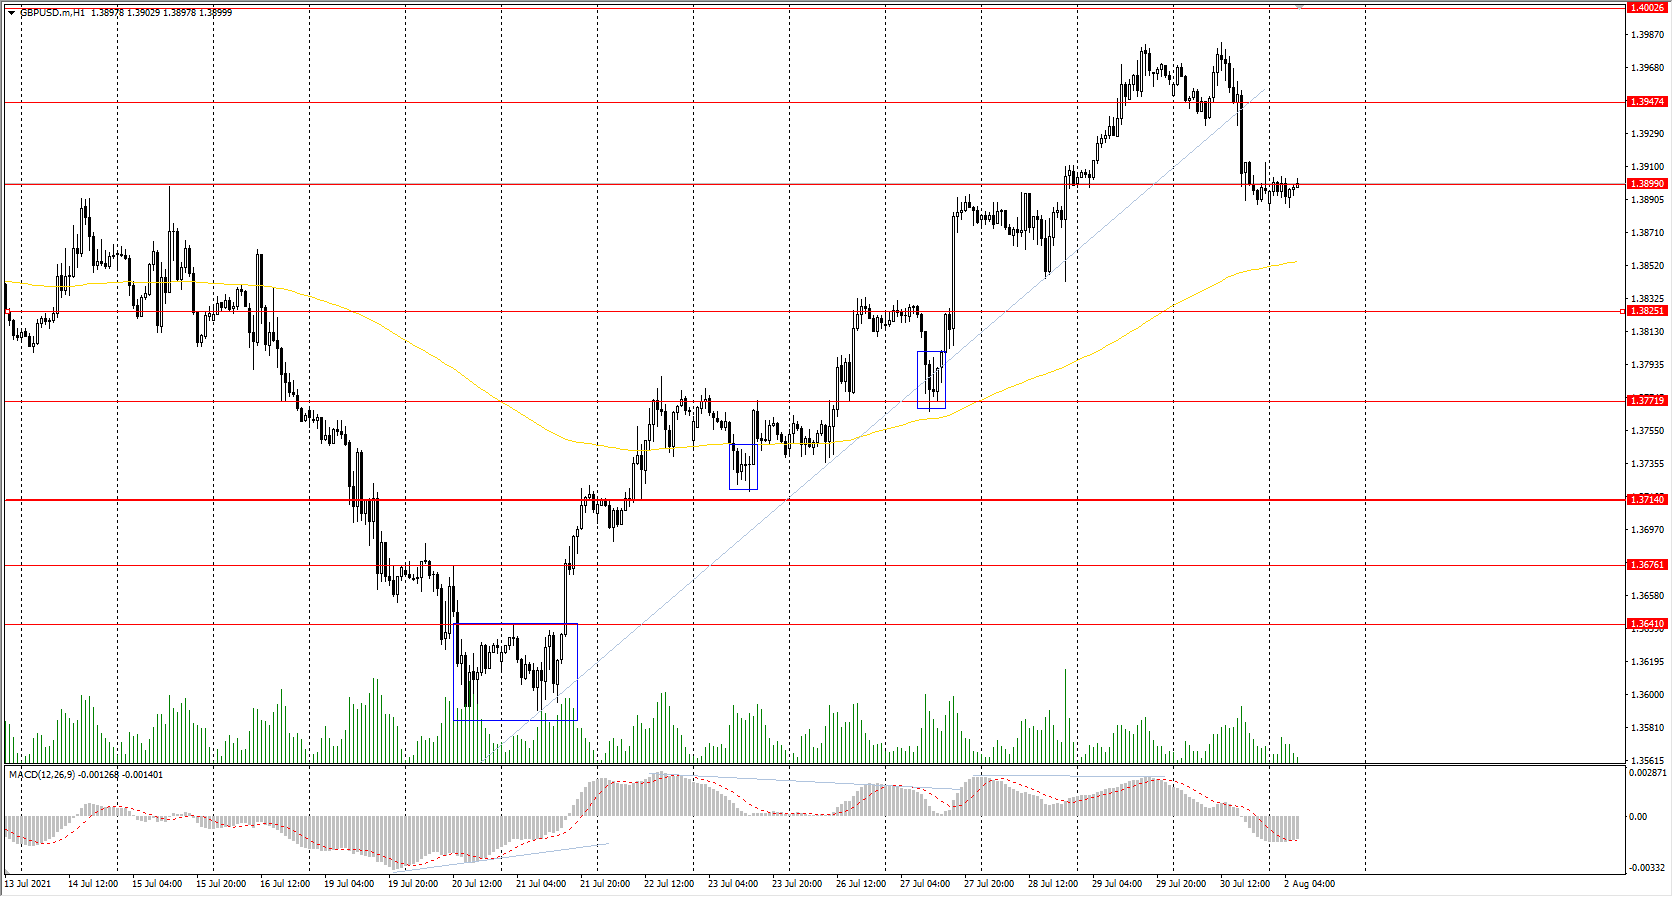
Prev Open: 1.3951
Prev Close: 1.3896
% chg. over the last day: -0.39%
The British pound showed stronger growth than the euro last week. However, against the background of the dollar index growth, the British pound decreased by 0.39% on Friday and broke the trend line. It means that the growth dynamics of the quotes have slowed down. But the MACD indicator began to signal the divergence and warned that a correction move would soon begin.
Trading recommendations
Support levels: 1.3900, 1.3825, 1.3772, 1.3714, 1.3676 ,1.3641, 1.3614, 1.3525
Resistance levels: 1.3947, 1.4002, 1.4075, 1.4101
The GBP/USD currency pair trend is bullish on the H1 timeframe. The MACD indicator went into the negative zone. Under such market conditions, traders can look for buy positions after the price pulls back to the support level. There are no optimal points for sell positions right now. Traders can search for intraday sell entries from the resistance level with short targets, but they should understand that it will be trading against the main trend.
Alternative scenario: if the price breaks down through the 1.3714 support level and consolidates below, the bearish scenario is likely to resume.
News feed for 2021.08.02:
- UK Manufacturing PMI (m/m) at 11:30 (GMT+3).
The USD/JPY currency pair
Technical indicators of the currency pair:
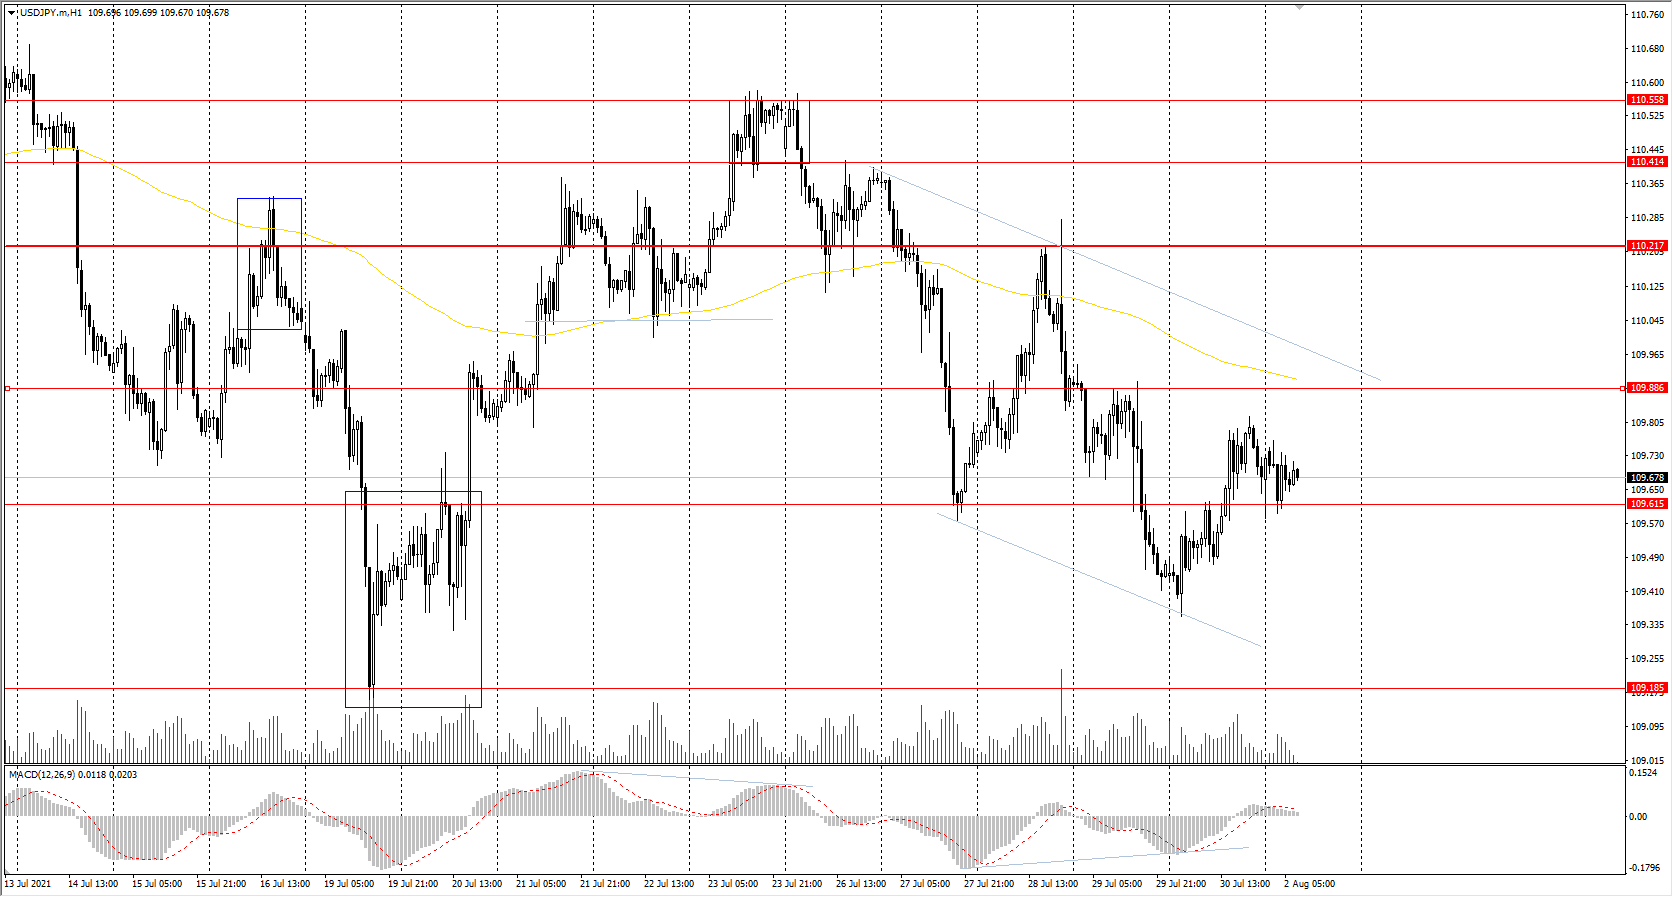
Prev Open: 109.45
Prev Close: 109.68
% chg. over the last day: +0.21%
The USD/JPY currency pair increased by 0.21% on Friday. Japanese government data showed that Japan’s unemployment rate fell to 2.9% (previously 3.0%) in June, and manufacturing activity increased. However, the Japanese Prime Minister’s advisor said that the economic losses from the Tokyo Olympics without fans would be huge. The absence of spectators could cost Japan’s economy 146.8 billion yen ($1.3 billion), and Japanese companies could see an estimated 10% increase in sales if fans were allowed. Economists expect Japan’s Q3 data to be weak.
Trading recommendations
Support levels: 109.61, 109.19, 108.65
Resistance levels: 109.88, 110.22, 110.41, 110.56
The main trend of the USD/JPY currency pair is bearish. The price is trading below the moving average. The MACD indicator has become inactive. Under such market conditions, it is best to look for sell positions from the resistance levels. Buy positions can be considered only intraday and only with short targets.
Alternative scenario: if the price rises above 110.22, the uptrend is likely to be resumed.
The USD/CAD currency pair
Technical indicators of the currency pair:
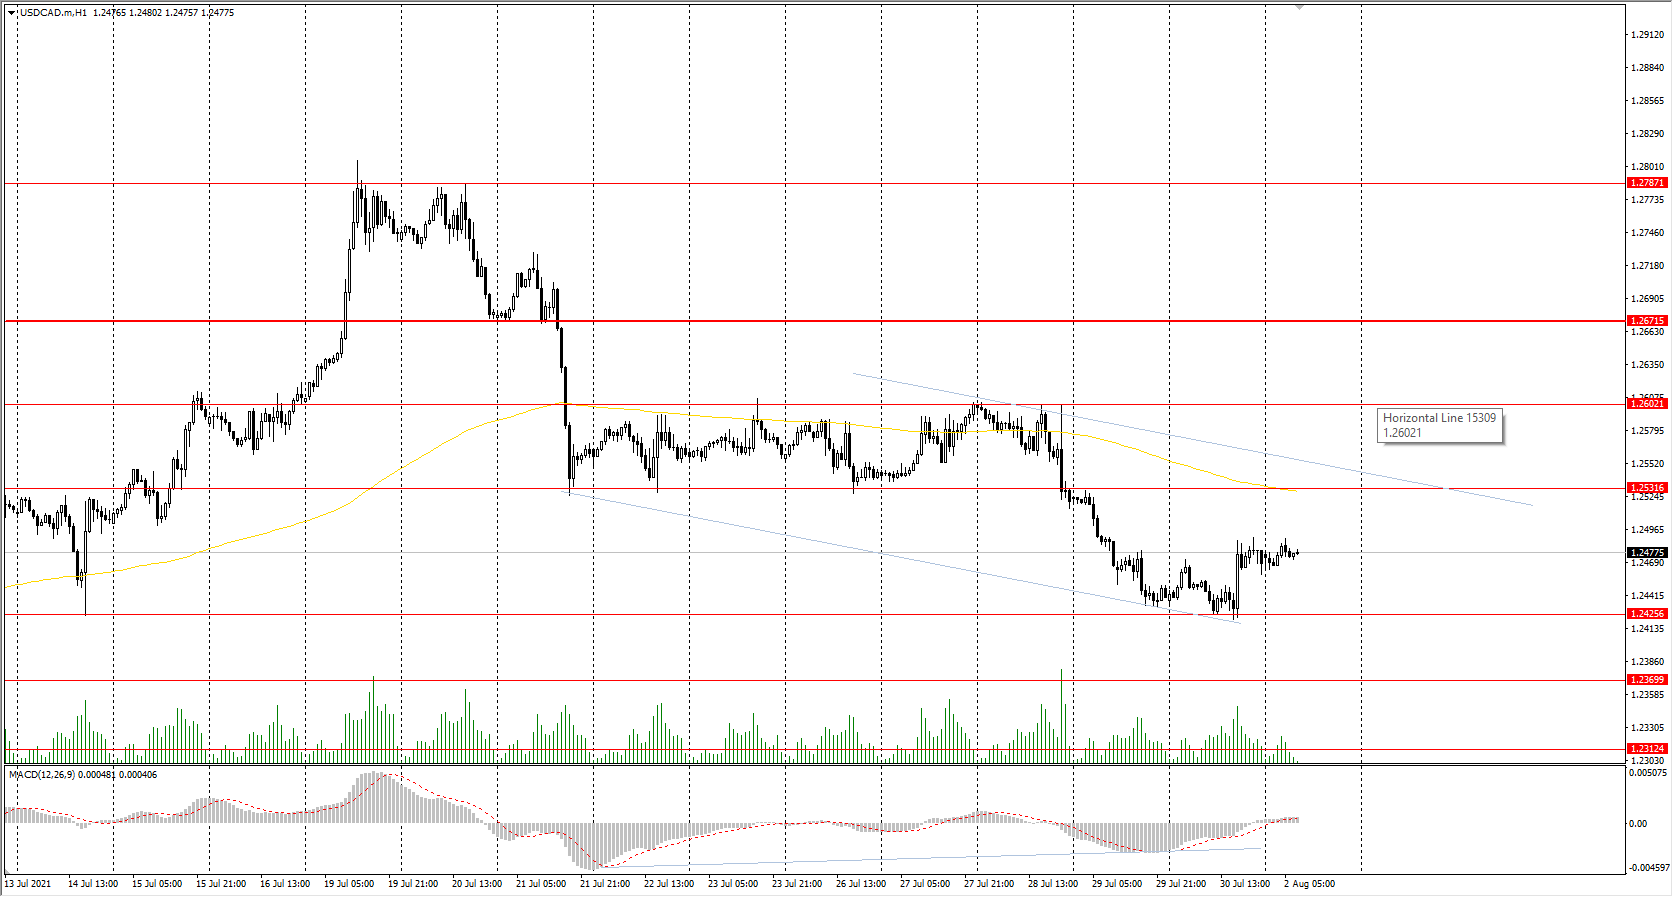
Prev Open: 1.2437
Prev Close: 1.2468
% chg. over the last day: +0.25%
Statistics Canada reported that Canadian GDP decreased by 0.3% as most of the country remained under economic restrictions to contain the third wave of COVID-19. But the forecast for June suggests GDP growth of 0.7%. Lower oil prices and a rise in the dollar index contributed to the USD/CAD quotes on Friday.
Trading recommendations
Support levels: 1.2425, 1.2370, 1.2312
Resistance levels: 1.2531, 1.2602, 1.2671, 1.2787, 1,2951
From the point of view of technical analysis, the USD/CAD trend is bearish. The MACD indicator has become inactive. Under such market conditions, traders should look for sell positions from the resistance levels after a small pullback. Buy positions can be considered only intraday and only with short targets.
Alternative scenario: if the price breaks out through the 1.2671 resistance level and fixes above, the uptrend is likely to be resumed.


