
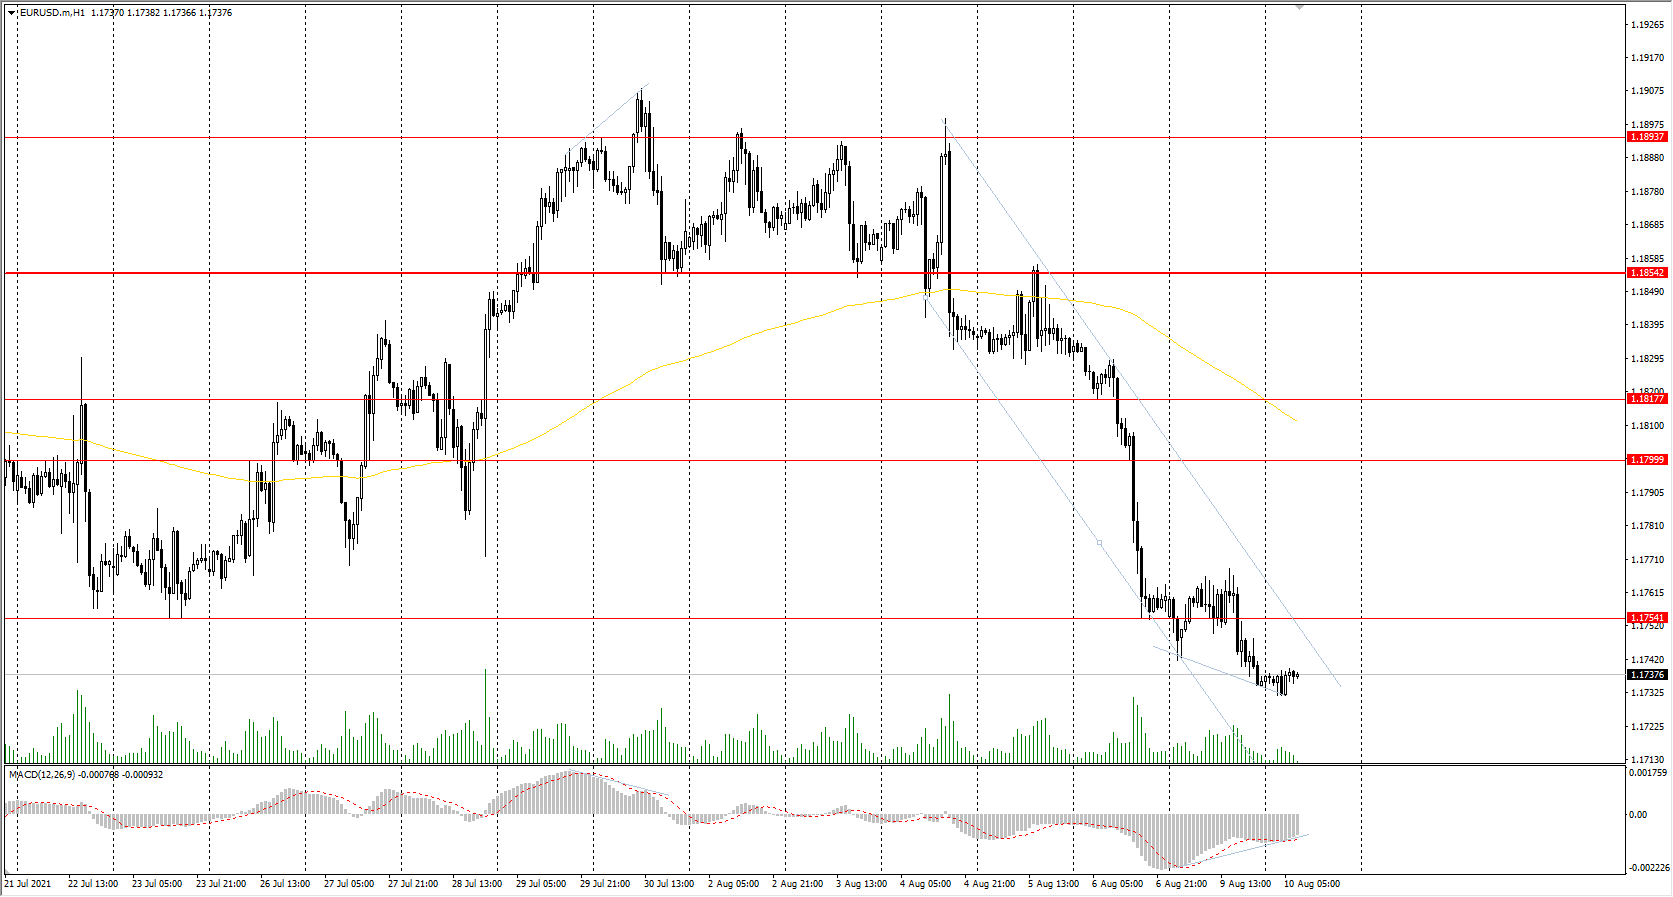
The EUR/USD currency pair
Technical indicators of the currency pair:
Prev Open: 1.1755
Prev Close: 1.1736
% chg. over the last day: -0.16%
There are no important events scheduled in Europe until the end of August (vacation season), so it’s the US policy that will mainly influence the European currency. At the moment, the dollar index is growing, which has a negative impact on the euro.
Trading recommendations
Support levels: 1.1609
Resistance levels: 1.1754, 1.1799, 1.1817, 1.1854, 1.1894, 1.1934, 1.1969
From a technical point of view, the general trend on the EUR/USD currency pair is bearish. The price went below the moving average; the MACD indicator is in the oversold zone, but there are signs of a reversal in the form of divergence. Under such market conditions, it is better to look for sell trades from the resistance levels, but after a slight upward correction since the price has deviated strongly from the middle line. Buy trades can only be considered throughout the day and only with confirmation in the form of a bullish initiative.
Alternative scenario: if the price breaks through the 1.1854 resistance level and fixes above, the mid-term uptrend is likely to resume.
News feed for 2021.08.10:
- Germany ZEW Economic Sentiment (m/m) at 12:00 (GMT+3)
- Eurozone ZEW Economic Sentiment (m/m) at 12:00 (GMT+3).
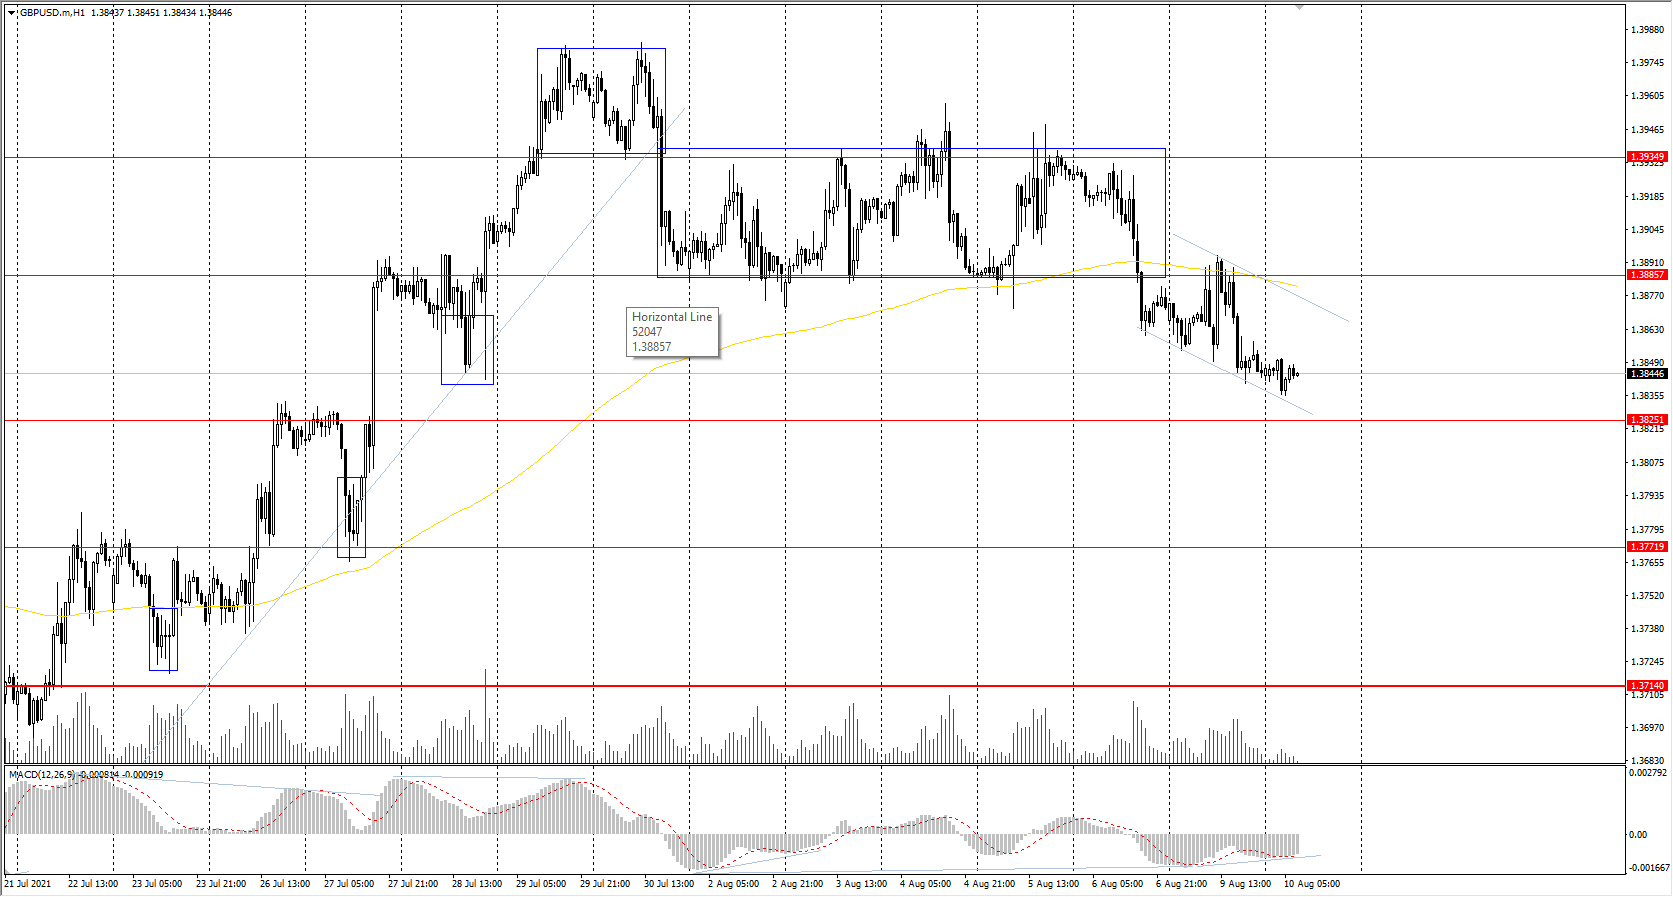
The GBP/USD currency pair
Technical indicators of the currency pair:
Prev Open: 1.3867
Prev Close: 1.3845
% chg. over the last day: -0.16%
The situation on the GBP/USD currency pair has not changed. Despite the decline, the British pound has gained a more confident position than the euro. The fundamental picture of the UK is now positive, so with any weakness in the dollar index, the British currency will continue to strengthen.
Trading recommendations
Support levels: 1.3825, 1.3772, 1.3714, 1.3676 ,1.3641, 1.3614, 1.3525
Resistance levels: 1.3886, 1.3935, 1.4002, 1.4075, 1.4101
On the hour timeframe, the trend of the GBP/USD currency pair is bullish. The price left the trading range in a downward direction, but if it returns to the indicated corridor, the price will immediately head to the 1.3935 resistance level. The MACD indicator went into the negative zone, but there are signs of a hidden divergence. Under such market conditions, traders are better to look for buy trades after breaking the resistance level of 1.3885. Sell positions can be considered from the resistance levels within the local downward movement.
Alternative scenario: if the price breaks through the 1.3714 support level and consolidates below, the bearish scenario is likely to resume.
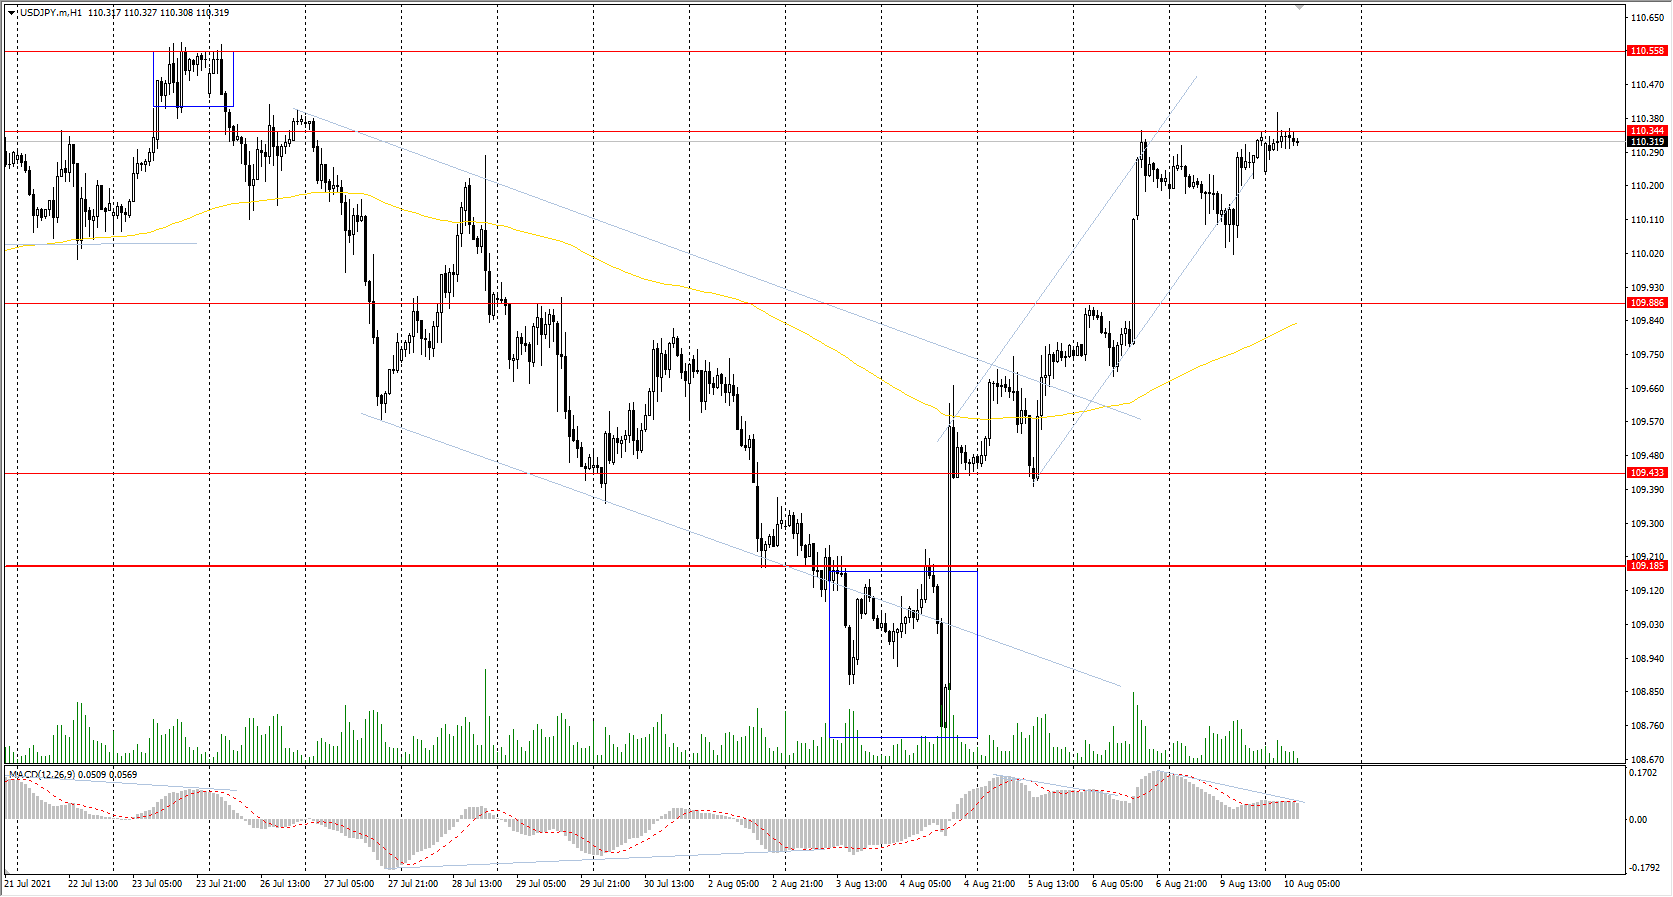
The USD/JPY currency pair
Technical indicators of the currency pair:
Prev Open: 110.22
Prev Close: 110.33
% chg. over the last day: +0.10%
The Japanese yen has stabilized, but its position is still weak. Against the background of the dollar index growth, the USD/JPY currency pair is growing. The USD/JPY quotes are strongly correlated with the dollar index now.
Trading recommendations
Support levels: 109.88, 109.43, 109.19, 108.65
Resistance levels: 110.34, 110.56
The main trend on the USD/JPY currency pair has changed to bullish. The MACD indicator is in the oversold zone, but there are signs of a reversal. Under such market conditions, it is better to look for buy positions after a small pullback downwards because the price has strongly deviated from the moving average. Sell positions should be considered only on the lower timeframes from the resistance level and only with short targets.
Alternative scenario: if the price falls below 109.19, the uptrend is likely to be broken.
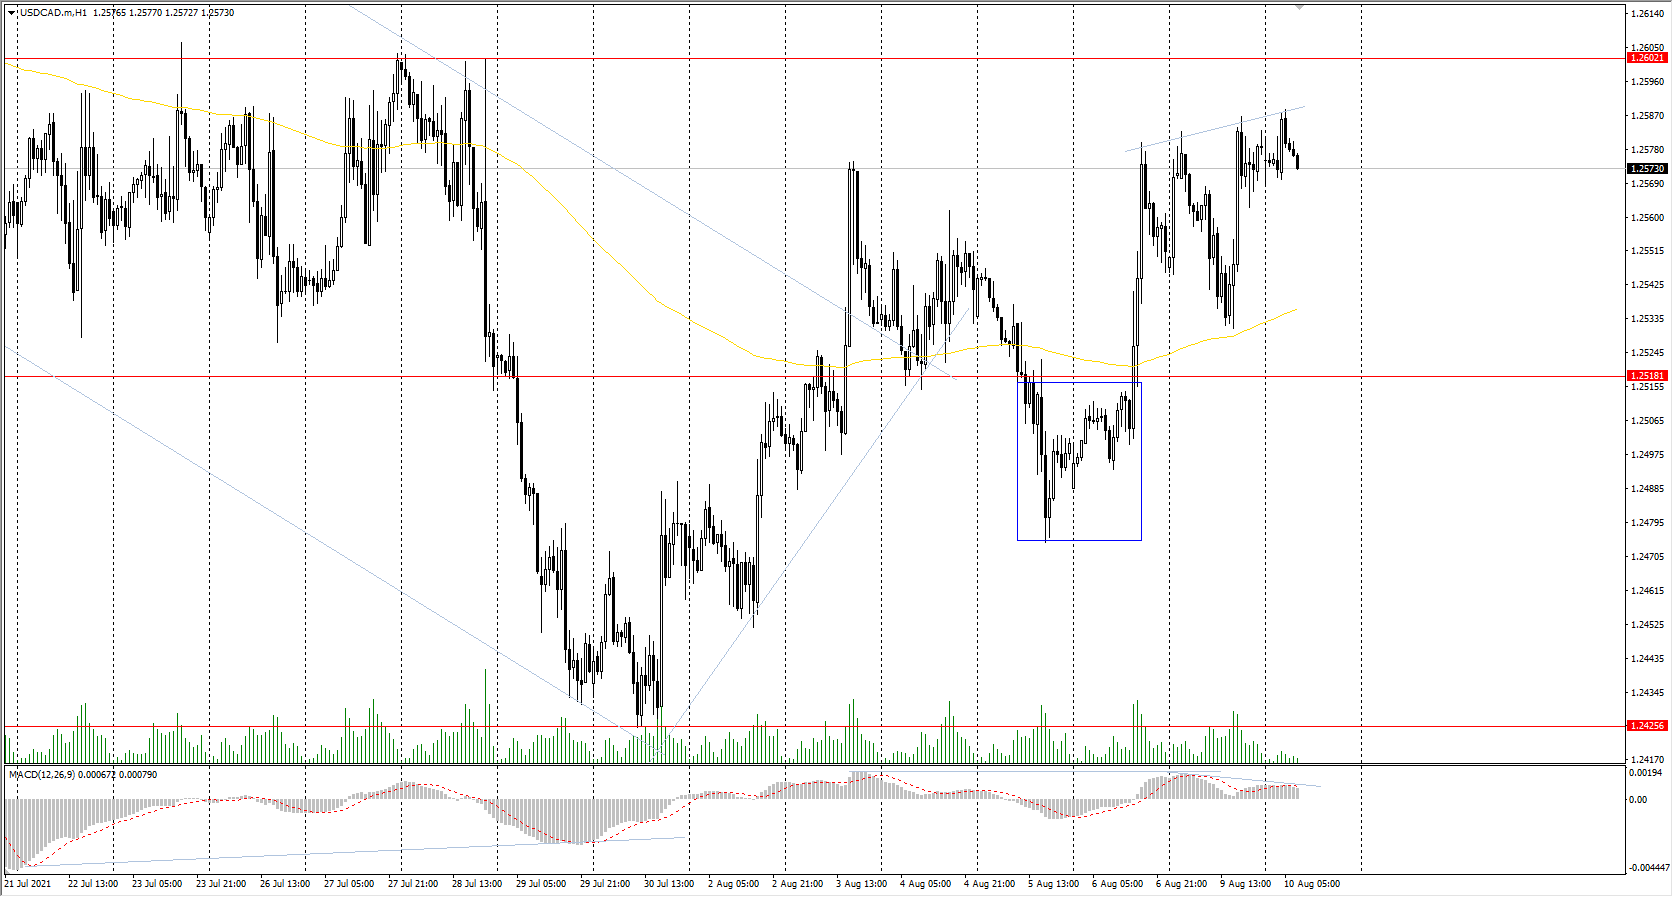
The USD/CAD currency pair
Technical indicators of the currency pair:
Prev Open: 1.2547
Prev Close: 1.2579
% chg. over the last day: +0.26%
The Canadian dollar is highly dependent on the dollar index and the oil price dynamics. The dollar index is rising, while oil prices also increased yesterday. As a result, the USD/CAD currency pair started to consolidate.
Trading recommendations
Support levels: 1.2518, 1.2471, 1.2425, 1.2370, 1.2312
Resistance levels: 1.2602, 1.2671, 1.2787, 1.2951
Considering technical analysis, the USD/CAD trend is bearish. The price is above the moving average, the MACD indicator is positive, but there are signs of divergence. Under such market conditions, traders should look for sell positions from the resistance levels after sellers show initiative. Traders should consider buy positions from the support levels and only on intraday timeframes.
Alternative scenario: if the price breaks through the 1.2671 resistance level and fixes above, the uptrend is likely to be resumed.


