
The EUR/USD currency pair
Technical indicators of the currency pair:
Prev Open: 1.1674
Prev Close: 1.1700
% chg. over the last day: +0.22%
The decrease in the dollar index has led to a slight increase in the quotes of the EUR/USD currency pair. A lot will now depend on the performance of the dollar index and the decisions of the Federal Reserve. If the soft monetary policy remains unchanged until the end of the year, the Euro might get much stronger in the near future. A lot of macroeconomic statistics on European countries will be published today.
Trading recommendations
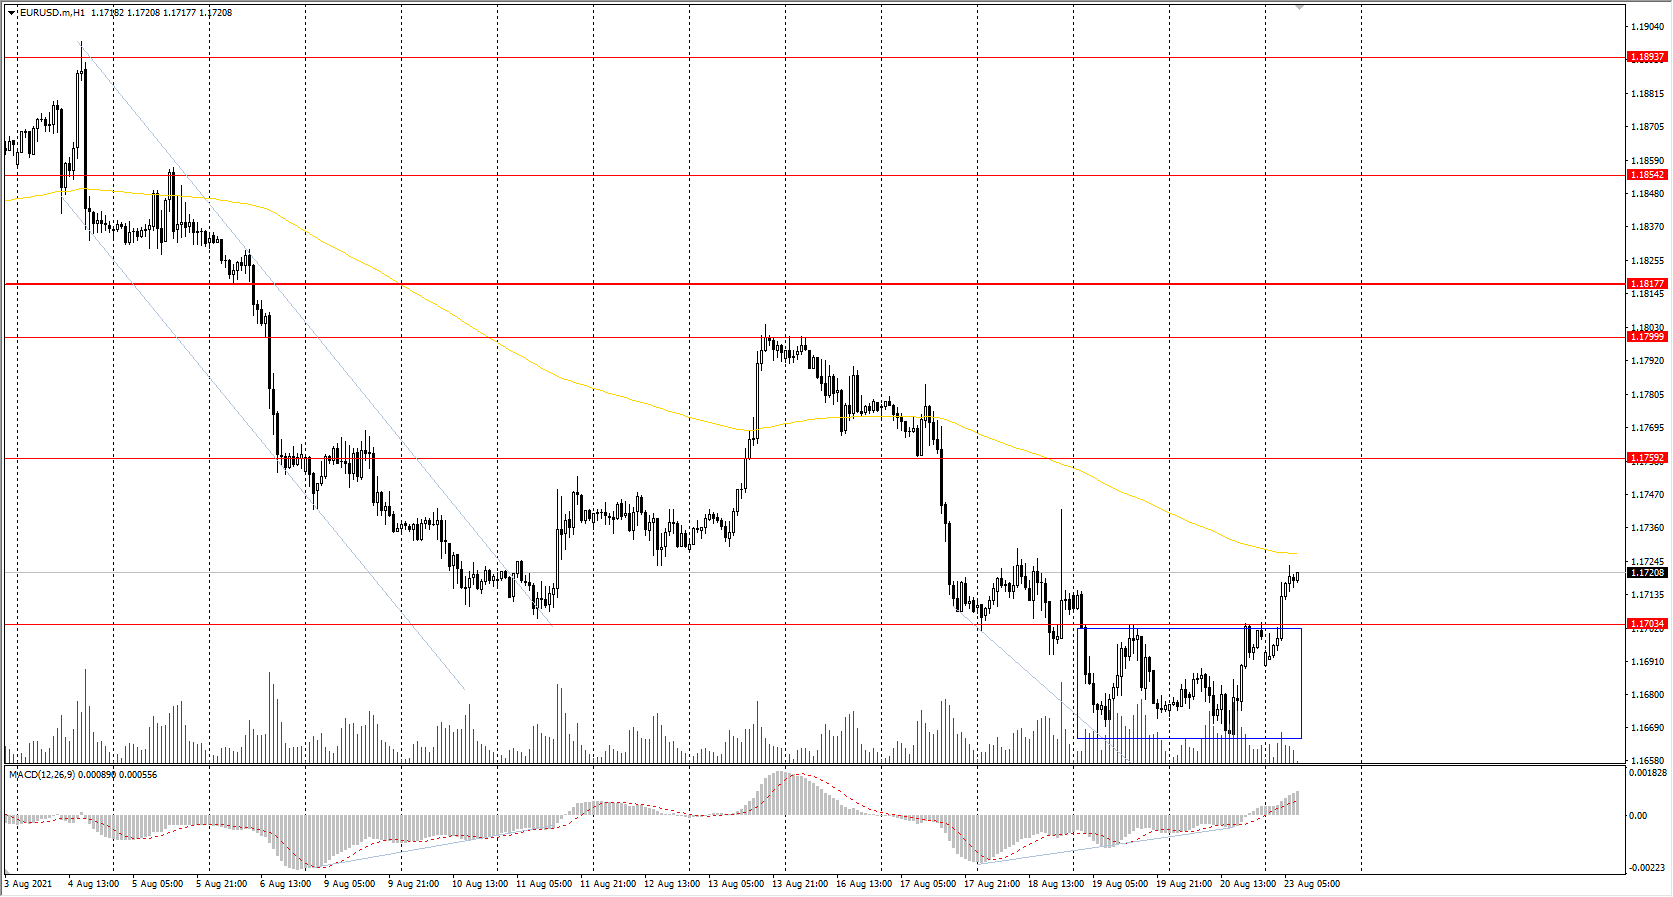
Support levels: 1.1704, 1.1620
Resistance levels: 1.1759, 1.1799, 1.1817, 1.1854, 1.1894, 1.1934, 1.1969
From a technical point of view, the general trend in the EUR/USD currency pair is bearish. The price has consolidated above the support level and formed a false breakdown zone below. Taking into account the divergence on the MACD indicator on the higher timeframes, the buyers’ pressure is higher now. Under such market conditions, it is best to look for sell trades from the resistance levels, where sellers showed the initiative. Buy trades can only be considered intraday from the support levels where the buyers have shown the initiative.
Alternative scenario: if the price breaks through the 1.1817 resistance level and fixes above, the mid-term uptrend will likely resume.
News feed for 2021.08.23:
- France Manufacturing PMI (m/m) at 10:15 (GMT+3);
- Germany Manufacturing PMI (m/m) at 10:30 (GMT+3);
- Eurozone Manufacturing PMI (m/m) at 11:00 (GMT+3);
- Eurozone Services PMI (m/m) at 11:00 (GMT+3);
- US Manufacturing PMI (m/m) at 16:45 (GMT+3);
- US Services PMI (m/m) at 16:45 (GMT+3);
- US Existing Home Sales (m/m) at 17:00 (GMT+3).
The GBP/USD currency pair
Technical indicators of the currency pair:
Prev Open: 1.3636
Prev Close: 1.3617
% chg. over the last day: -0.14%
UK retail sales fell by 2.5% in July compared to the previous month, which caused short-term sales in the GBP/USD currency pair. On the other hand, the UK government borrowing almost halved to 10.4 billion pounds in July compared to the same month a year ago. Given a temporary increase in oil prices and a decline in the dollar index, it boosted the British currency at the opening of trading on Monday.
Trading recommendations
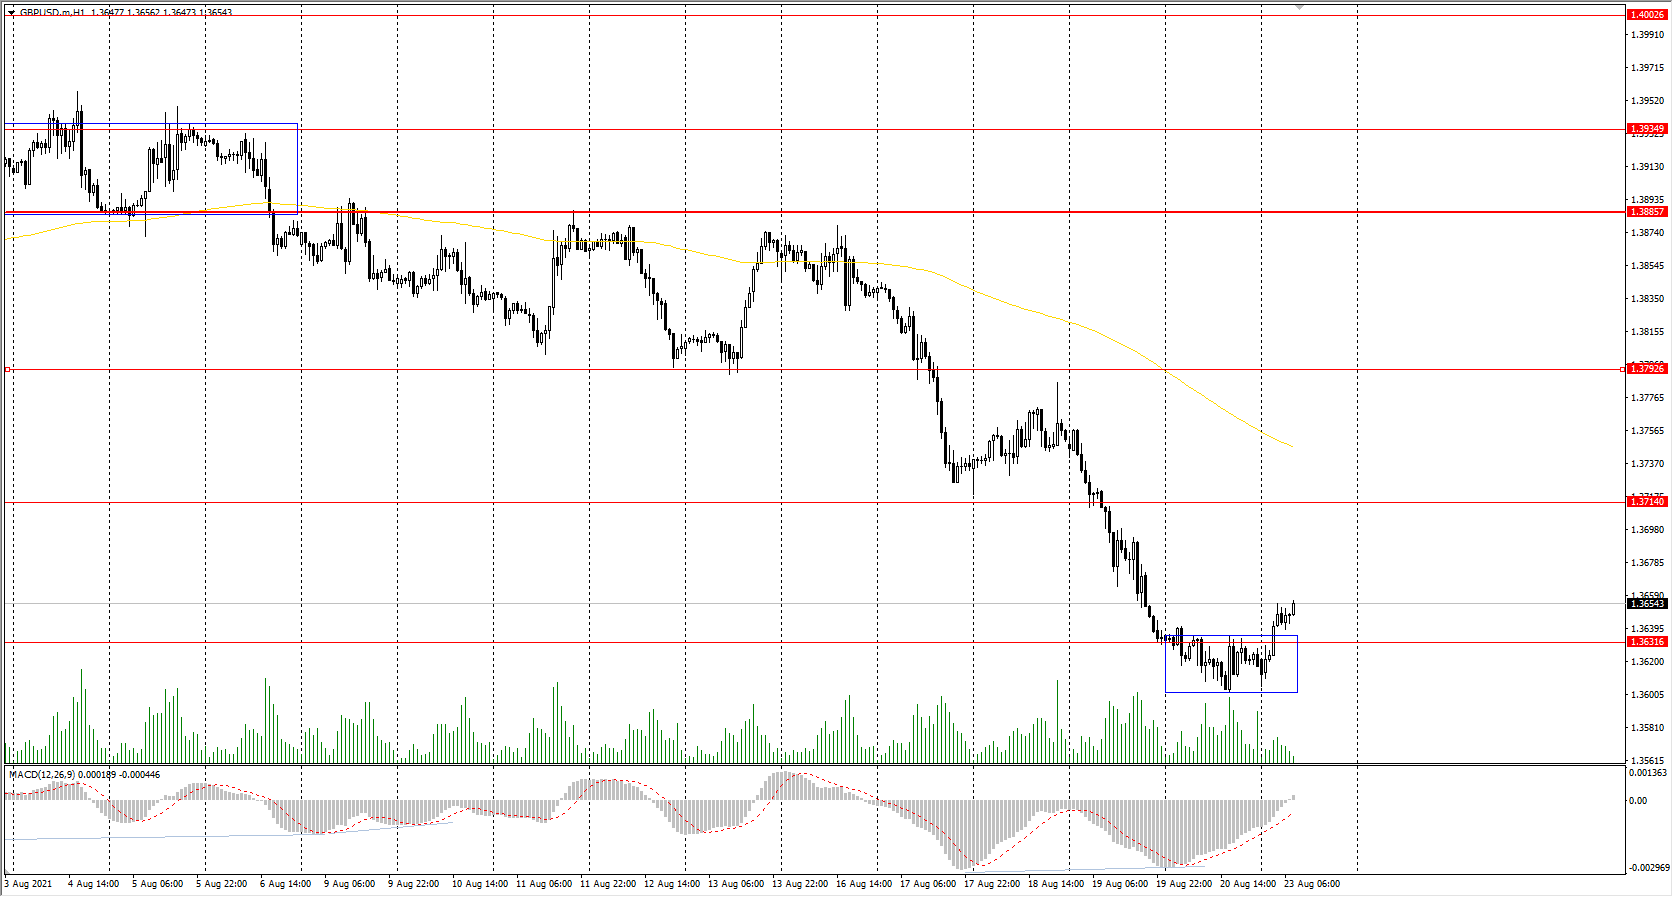
Support levels: 1.3632, 1.3614, 1.3525
Resistance levels: 1.3714, 1.3793, 1.3772, 1.3886, 1.3935, 1.4002
On the hourly time frame, the GBP/USD trend is bearish. The price has consolidated above the support level and formed a false breakdown zone below. The MACD indicator shows a divergence. Under such market conditions, it is better to look for sell trades from the resistance levels. But the price is now strongly deviated from the moving average, and given the presence of support and the divergence, there is a high probability of a bounce upward.
Alternative scenario: if the price breaks out through the 1.3885 resistance level and consolidates above, the bullish scenario will likely resume.
News feed for 2021.08.23:
- UK Manufacturing PMI (m/m) at 11:30 (GMT+3);
- UK Services PMI (m/m) at 11:30 (GMT+3).
The USD/JPY currency pair
Technical indicators of the currency pair:
Prev Open: 109.68
Prev Close: 109.77
% chg. over the last day: +0.08%
Growth in manufacturing activity in Japan has slowed, while the services sector has seen its fastest contraction since last May. Such negative statistics are related to the consequences of introducing a state of emergency in the country’s prefectures to suppress the Delta strain. Japan’s economic indicators for the third quarter will be weak.
Trading recommendations
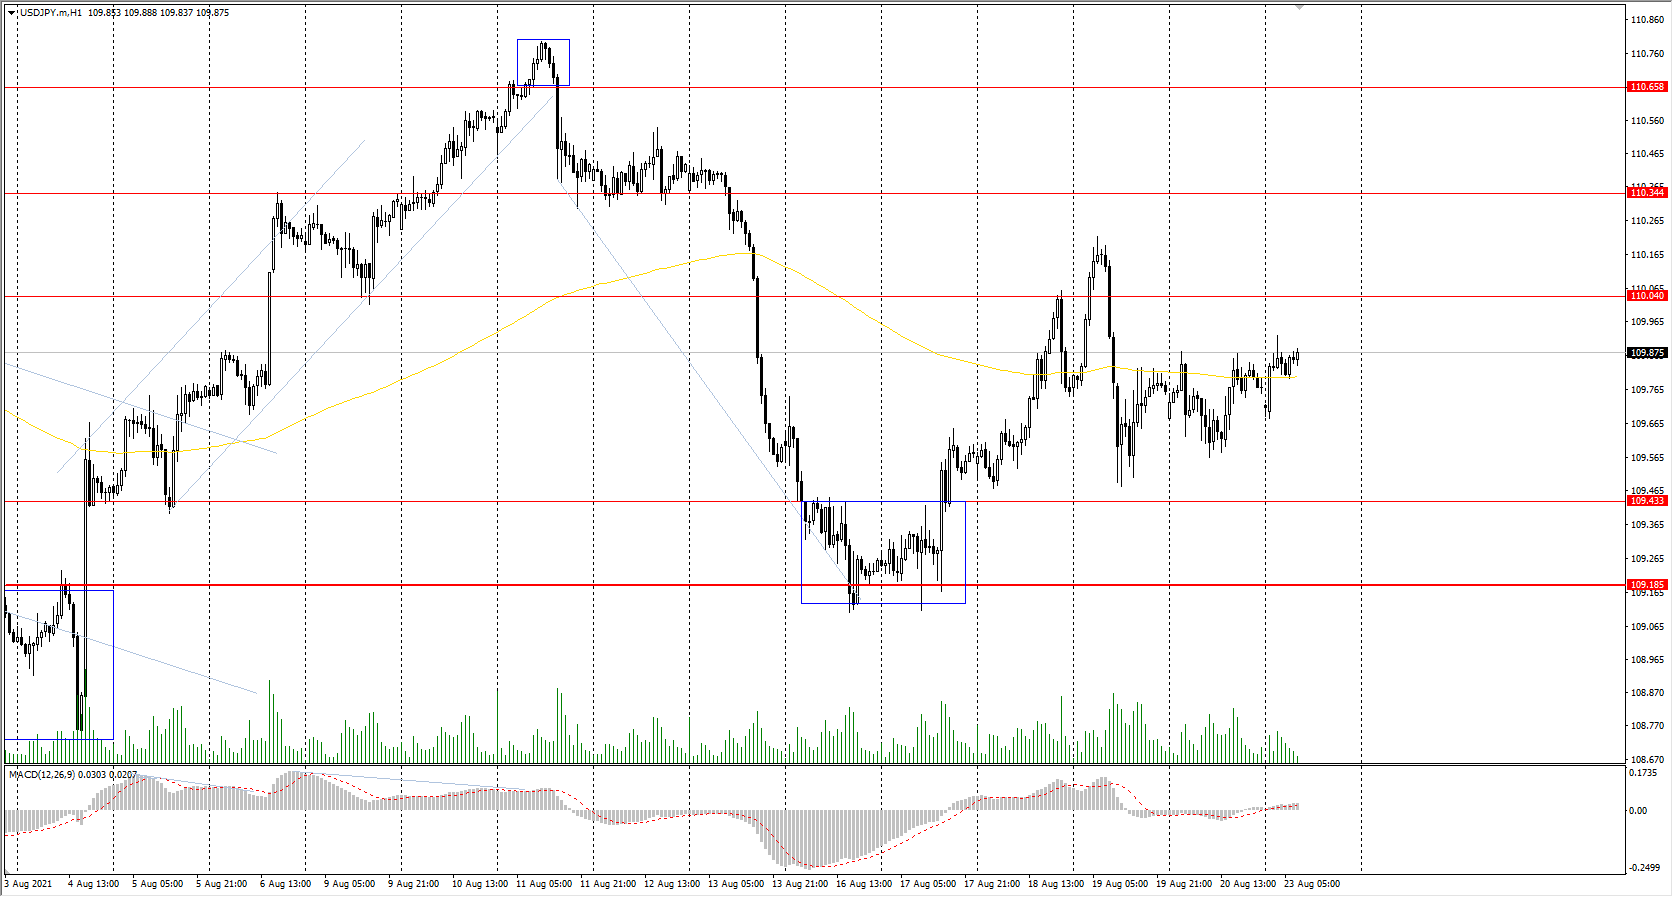
Support levels: 109.43, 109.19, 108.65
Resistance levels: 110.04, 110.34, 110.66, 110.95, 111.48
The main trend on the USD/JPY currency pair is bullish. The fall of the dollar index compensated for the negative impact of the news on the Japanese Yen. As a result, the USD/JPY currency pair is trading flat. The MACD indicator has become inactive. Under such market conditions, it is best for traders to look for buy trades from the support level, where the buyers have shown initiative. Sell positions should be considered only on lower timeframes from the resistance levels and only with short targets.
Alternative scenario: if the price falls below 109.18, the uptrend is likely to be broken.
News feed for 2021.08.23:
- Japan Manufacturing PMI (m/m) at 03:30 (GMT+3).
The USD/CAD currency pair
Technical indicators of the currency pair:
Prev Open: 1.2823
Prev Close: 1.2820
% chg. over the last day: -0.02%
The USD/CAD currency pair is highly dependent on the dynamics of the dollar index and oil prices. The dollar index started to correct while the oil prices slightly increased, which caused the strengthening of the Canadian dollar and a decrease in the USD/CAD quotes.
Trading recommendations
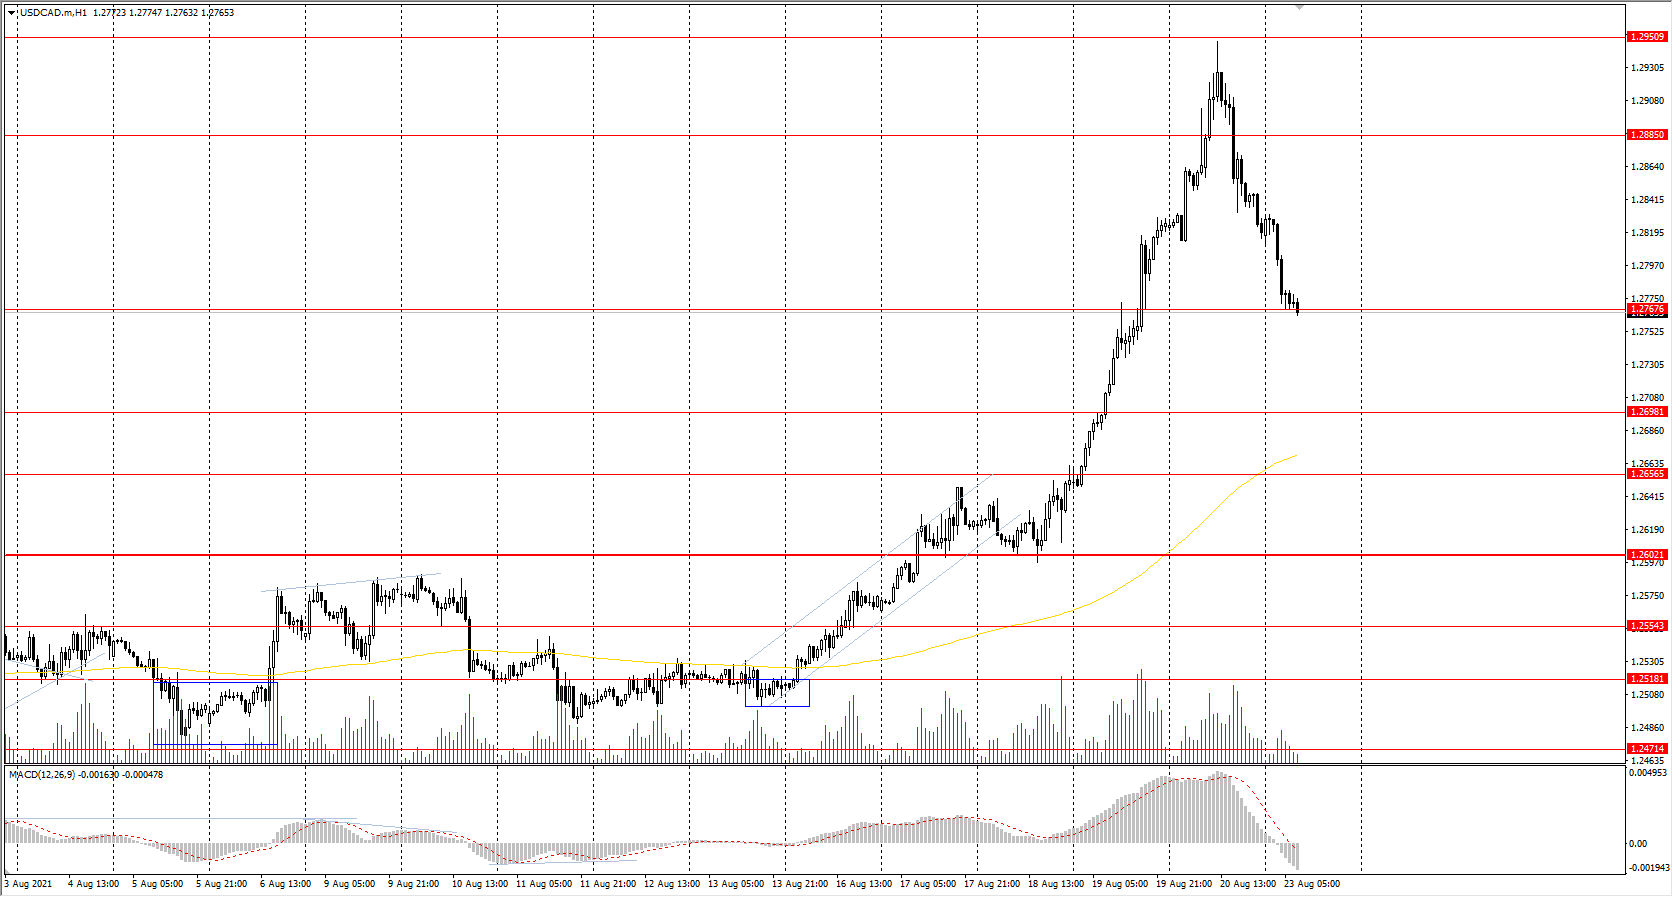
Support levels: 1.2767, 1.2698, 1.2656
Resistance levels: 1.2885, 1.2951
In terms of technical analysis, the USD/CAD trend is bullish. But now, the price has started a corrective movement. Buy positions should be considered from the support levels after the buyers’ initiative. Sell positions should be considered only from the resistance levels and only with short targets, as it will be trading against the main trend.
Alternative scenario: if the price breaks through down the 1.2602 support level and fixes below, the uptrend is likely to be broken.


