Contributors Technical Analysis EURNZD Bouncing Strongly From Elliott Wave Blue Box Area

EURNZD Bouncing Strongly From Elliott Wave Blue Box Area

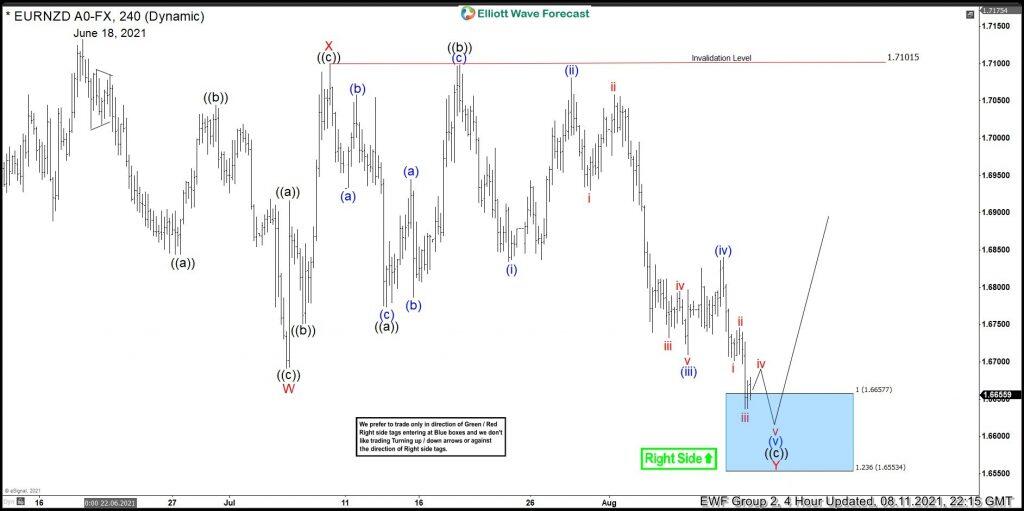
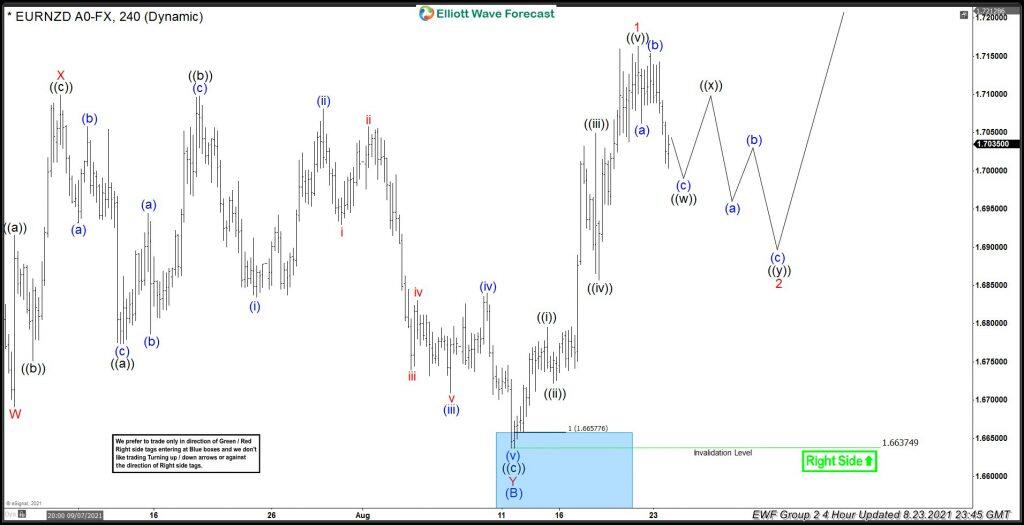
In this technical blog, we will look at the past performance of 4 hour Elliott Wave Charts of EURNZD, which we presented to members at the elliottwave-forecast. In which, the pullback from 18 June 2021 high unfolded as a double three structure & showed a blue box area. A green right side tag suggested buying opportunity in the pair looking for the next leg higher or for a 3 wave bounce at least. We will explain the structure & forecast below:

EURNZD 4 Hour Elliott Wave Chart

Here’s 4hr Elliott wave chart of EURNZD from the 8/11/2021 update. In which, the pullback from 6/18/2021 high unfolded as Elliott wave double three structure where wave W ended at 1.6691 low. Wave X bounce ended at 1.7101 high and wave Y managed to reach the blue box area at 1.6657- 1.6553. From where buyers were expected to appear looking for more upside or for a 3 wave bounce at least.

EURNZD Latest 4 Hour Elliott Wave Chart

NO COMMENTS

LEAVE A REPLY

Please enter your comment!
Please enter your name here

Exit mobile version