
The EUR/USD currency pair
Technical indicators of the currency pair:
Prev Open: 1.1755
Prev Close: 1.1772
% chg. over the last day: +0.14%
The business climate index of Germany from the IFO institute has been decreasing for the second month in a row. The reasons for the drop are problems with the supply chain of goods to production and fears of new restrictions due to the increase in the number of Delta cases. On the other hand, the European Central Bank announced that it may revise its macroeconomic forecasts for the Eurozone in September after the good performance in the third quarter.
Trading recommendations
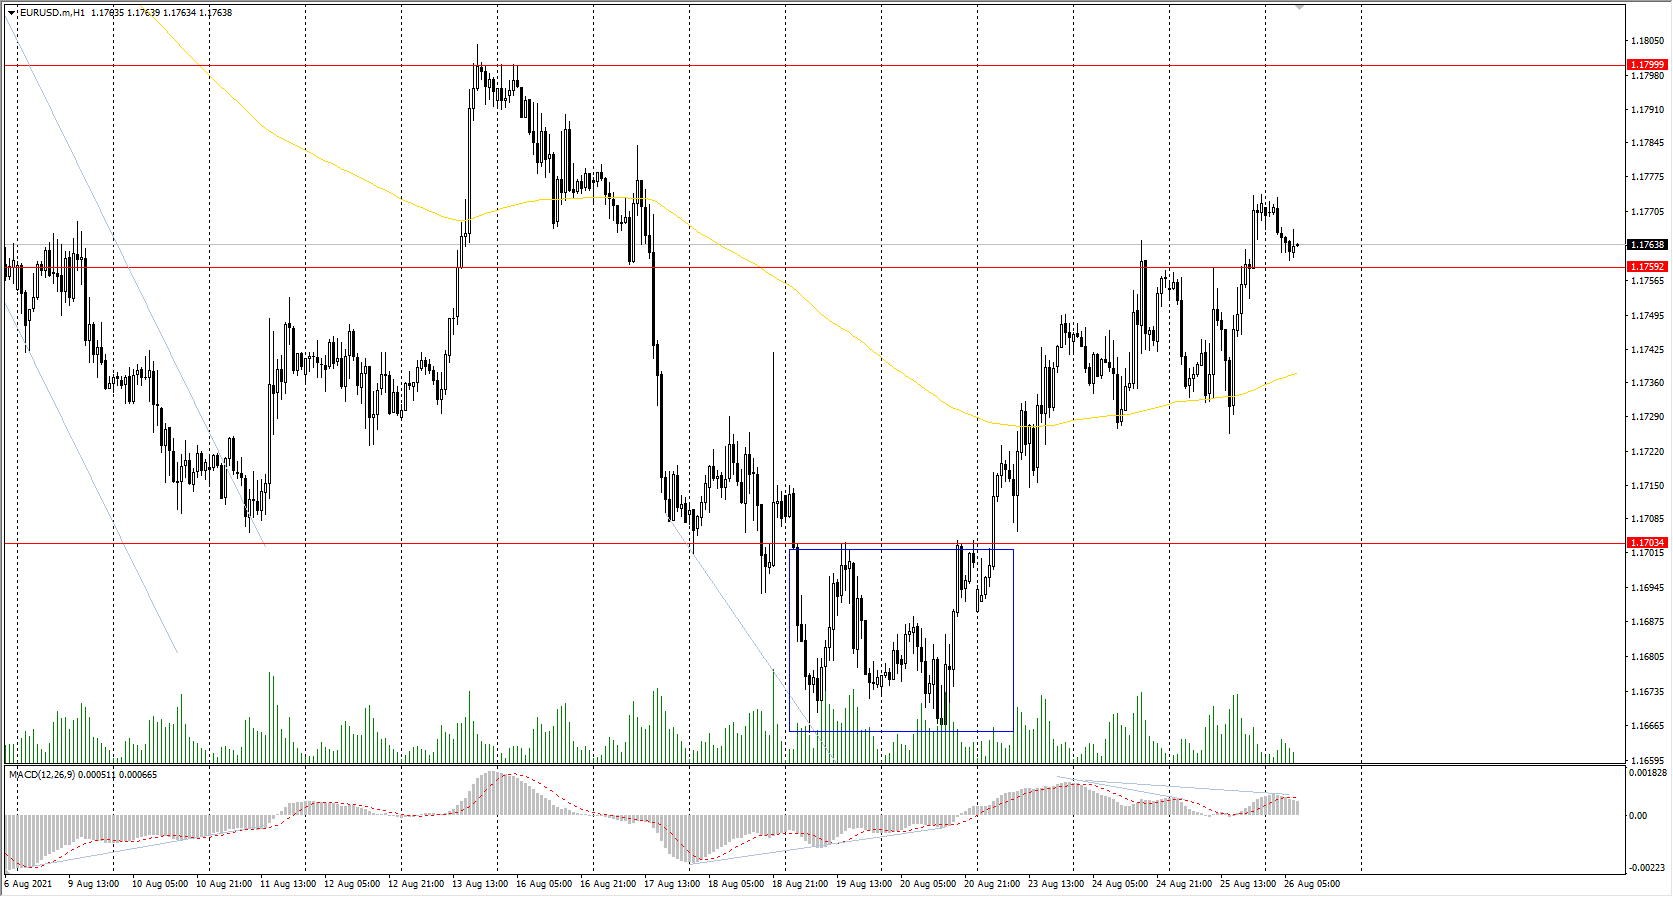
Support levels: 1.1759, 1.1704, 1.1620
Resistance levels: 1.1799, 1.1817, 1.1854, 1.1894, 1.1934, 1.1969
From a technical point of view, the general trend of the EUR/USD currency pair is bearish. But the price is trading above the moving average, and the local trend is upward now. The MACD indicator started signaling a divergence in the opposite direction. Under such market conditions, it is best to look for sell trades from the resistance levels, where sellers showed the initiative. Buy trades can only be considered intraday from the support levels where the buyers have shown the initiative. It is better to buy from the false breakdown zone around the 1.1703 level.
Alternative scenario: if the price breaks out through the 1.1817 resistance level and fixes above, the mid-term uptrend will likely resume.
News feed for 2021.08.26:
- Jackson Hole Symposium (Day 1);
- Release of ECB’s Account of Monetary Policy Meeting at 14:30 (GMT+3);
- US GDP (q/q) at 15:30 (GMT+3);
- US Initial Jobless Claims (w/w) at 15:30 (GMT+3).
The GBP/USD currency pair
Technical indicators of the currency pair:
Prev Open: 1.3728
Prev Close: 1.3763
% chg. over the last day: +0.25%
The dollar index is declining for the third session in a row amid growing opinion among economists that Mr. Powell will not announce the QE program cutting at the symposium in Jackson Hole. This situation plays in favor of the British pound, which restores its positions due to the dollar weakness.
Trading recommendations
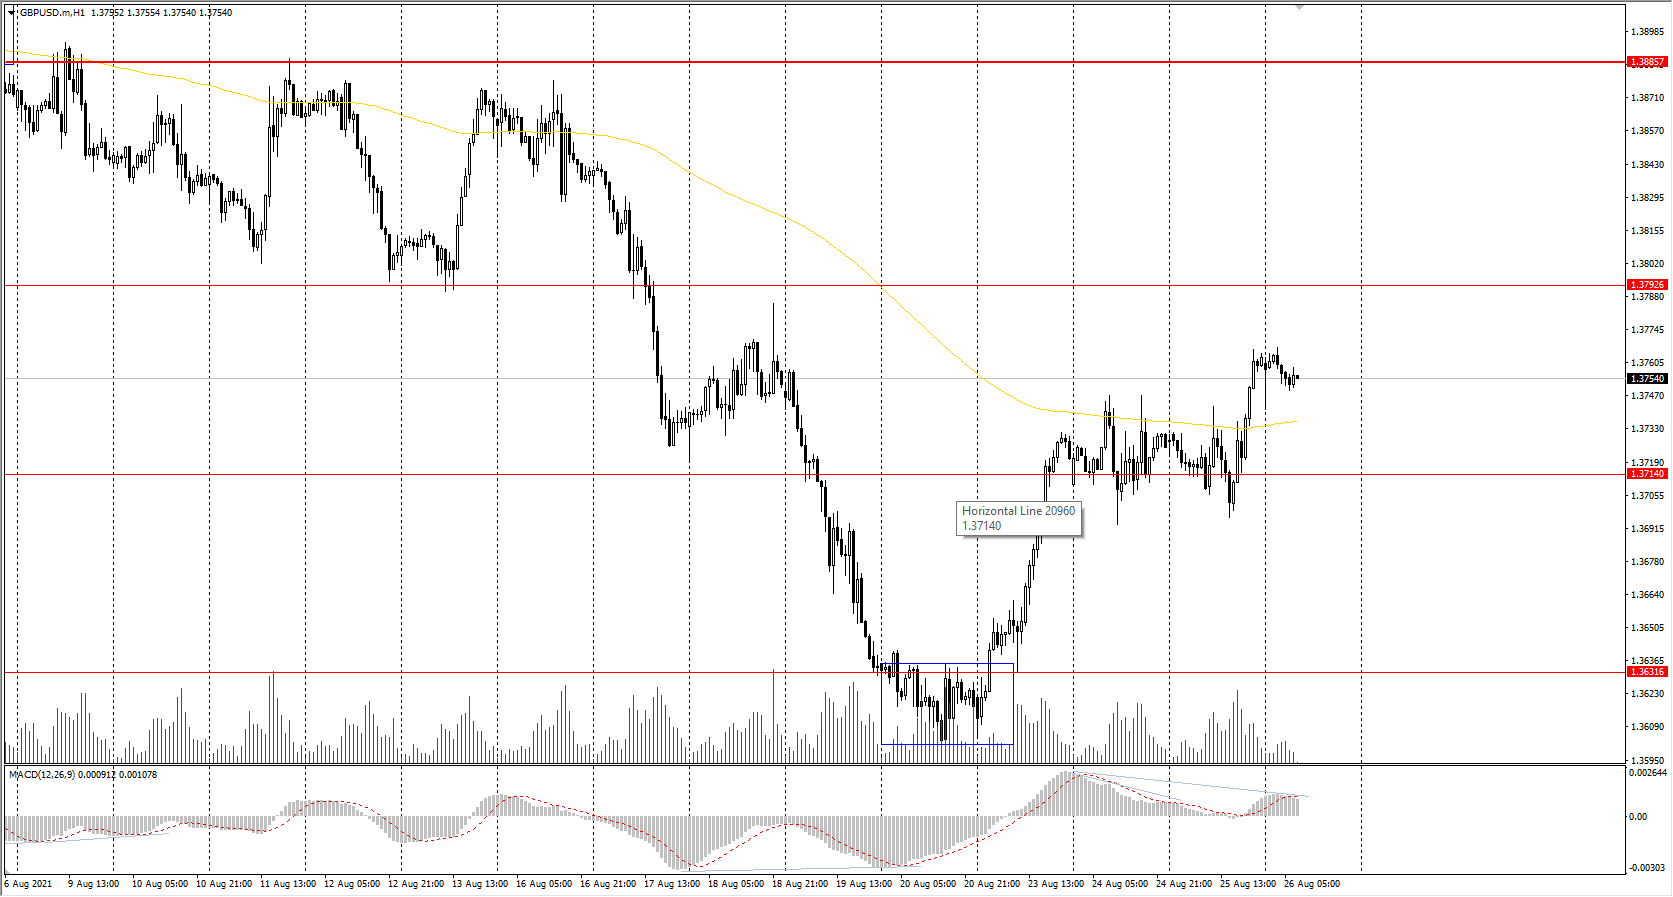
Support levels: 1.3714, 1.3632, 1.3614, 1.3525
Resistance levels: 1.3793, 1.3772, 1.3886, 1.3935, 1.4002
On the hourly time frame, the GBP/USD trend is bearish. The price has consolidated above the support level and formed a false breakdown zone below. The MACD indicator has become positive, but there are signs of divergence. Under such market conditions, it is better to look for sell trades from the resistance levels after the sellers show initiative. Buy positions can be considered only within the day and only with short targets.
Alternative scenario: if the price breaks out through the 1.3885 resistance level and consolidates above, the bullish scenario will likely resume.
The USD/JPY currency pair
Technical indicators of the currency pair:
Prev Open: 109.59
Prev Close: 109.98
% chg. over the last day: +0.36%
The situation with the virus outbreak in Japan remains tense. Yesterday, the Japanese Ministry of Health announced that “foreign material” had been found in some doses of the Moderna vaccine out of about 560,000 vials. As a result, Japan has suspended the use of about 1.63 million doses until clarification of the reasons.
Trading recommendations
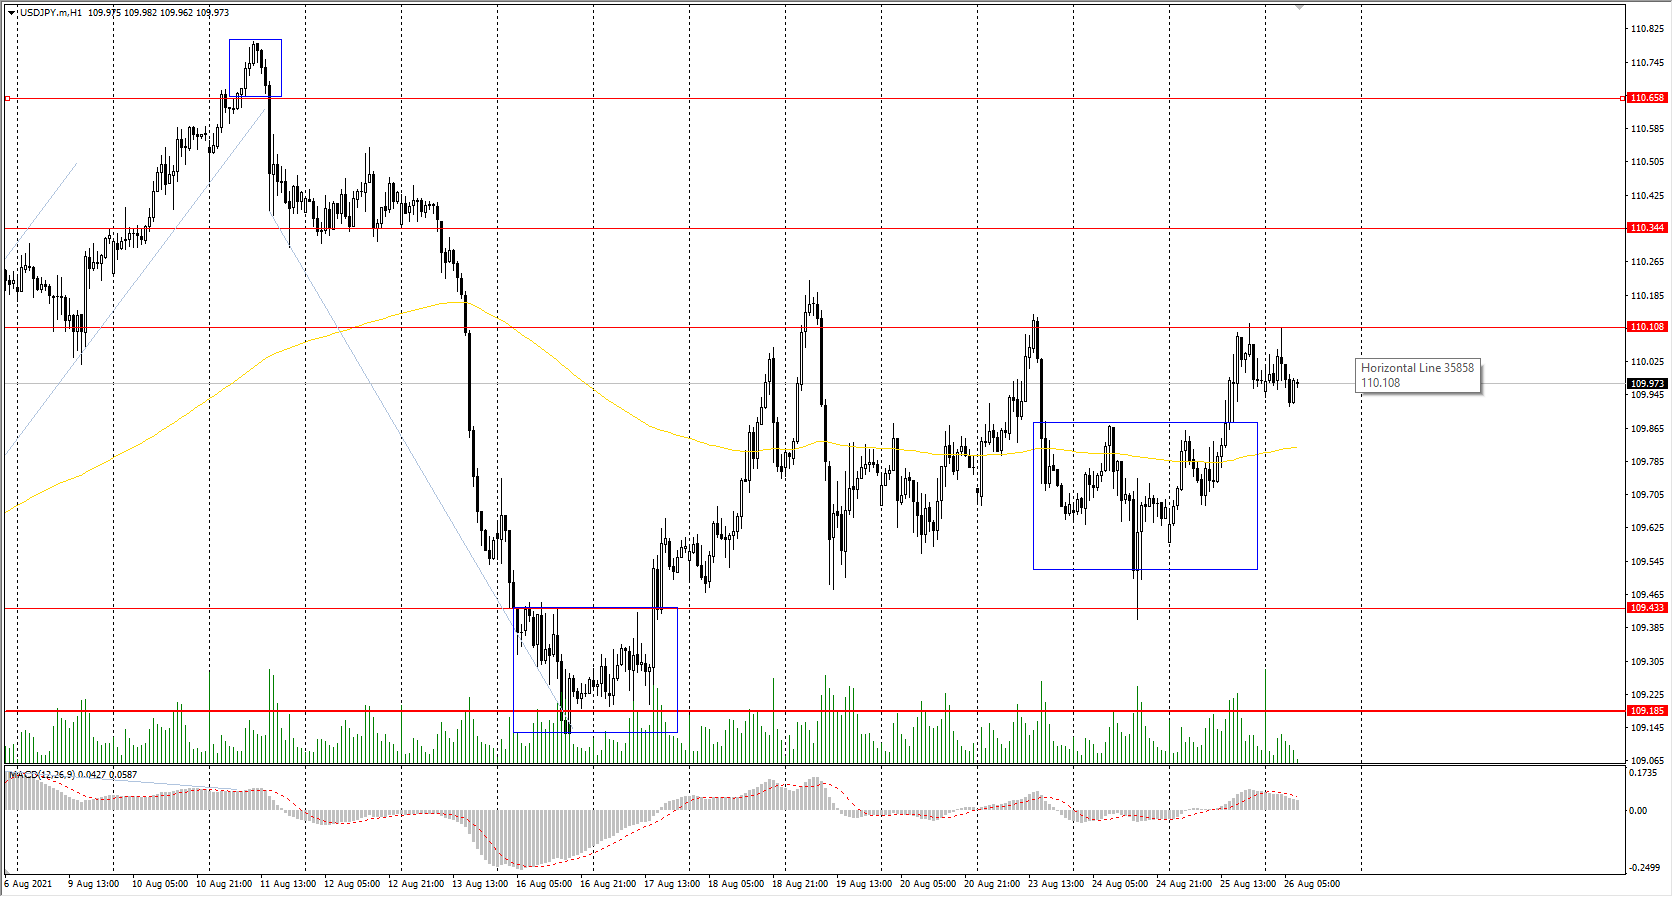
Support levels: 109.43, 109.19, 108.65
Resistance levels: 110.11, 110.34, 110.66, 110.95, 111.48
The main trend of the USD/JPY currency pair is bullish. The fall of the dollar index compensated for the negative impacts of the news. As a result, the USD/JPY currency pair is trading flat. The MACD indicator is inactive. Under such market conditions, it is best for traders to look for buy trades from the support level, where the buyers have shown initiative. Sell positions should be considered only on lower time frames from the resistance levels and only with short targets.
Alternative scenario: if the price falls below 109.18, the uptrend is likely to be broken.
The USD/CAD currency pair
Technical indicators of the currency pair:
Prev Open: 1.2586
Prev Close: 1.2586
% chg. over the last day: 0.00%
The Canadian dollar is a commodity currency, so the USD/CAD currency pair is highly dependent on the dynamics of the dollar index and oil prices. Now the dollar and oil situation becomes more confusing, so it is not surprising that the USD/CAD currency pair is trading in the range. In Canada, some provinces have issued regulations prohibiting people from going to restaurants, cinemas, and other social and entertainment events without presenting a vaccination passport. As a result, the number of people who register for vaccinations is up 201% from last week.
Trading recommendations
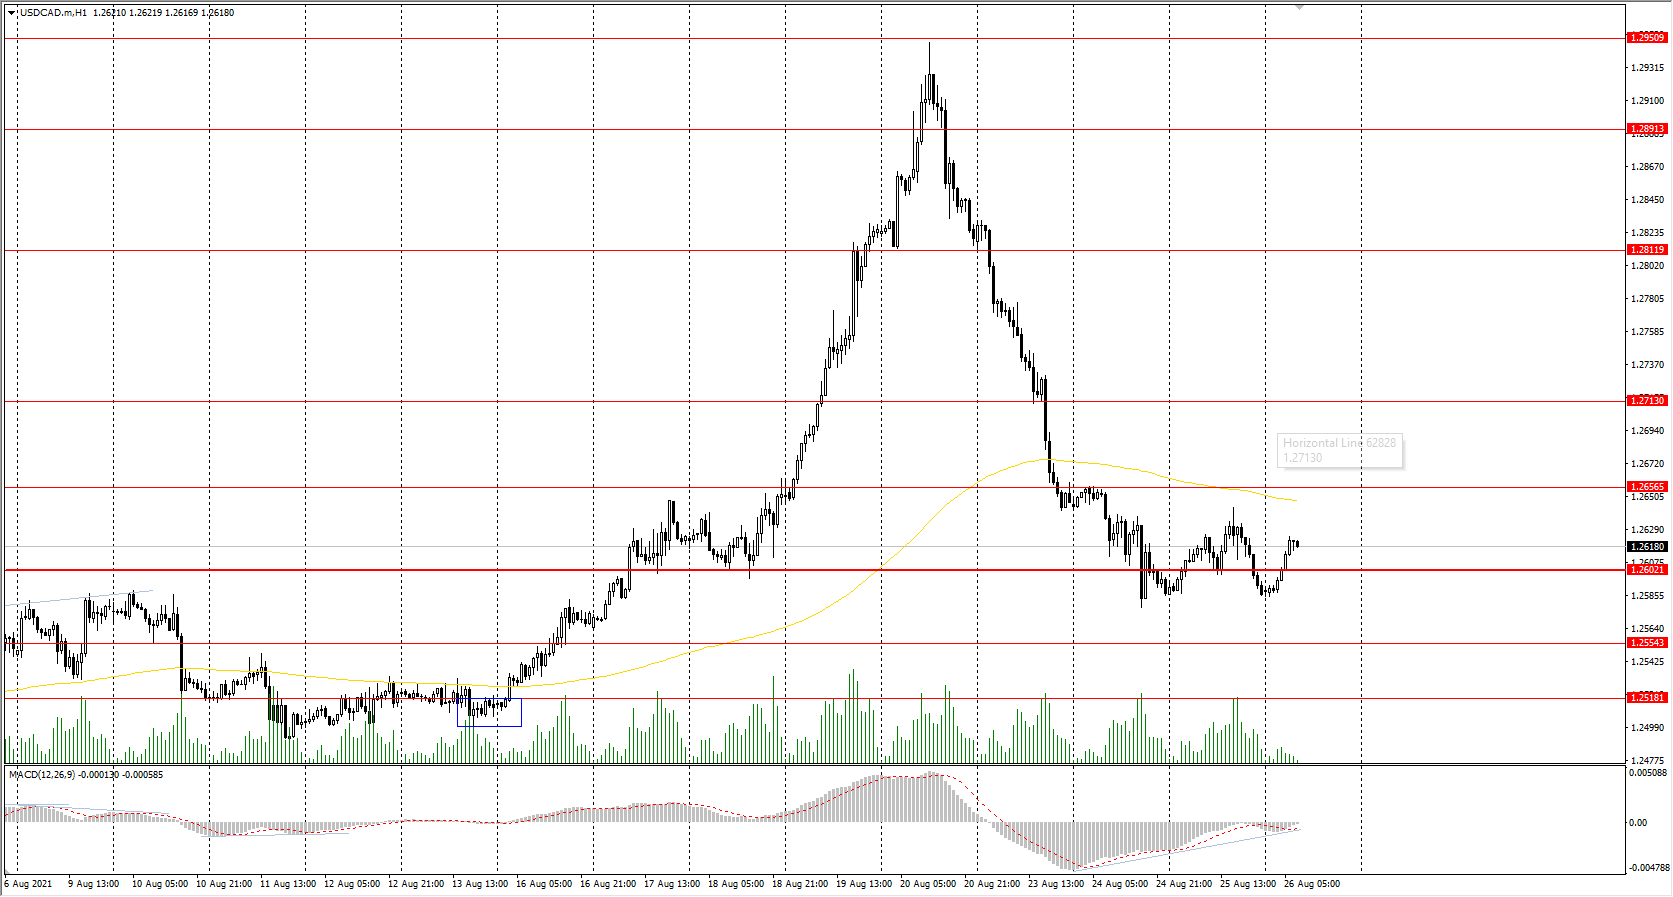
Support levels: 1.2602, 1.2554
Resistance levels: 1.2656, 1.2713, 1.2812, 1.2891, 1.2951
In terms of technical analysis, the USD/CAD trend is still bullish. However, the price has approached the priority change level and tried to break it down several times but failed to consolidate below the level. The MACD indicator is signaling a divergence. It is better to look for buy positions from the priority change level after the buyer’s initiative. There are no optimal entry points for sell deals now because the support level is ahead.
Alternative scenario: if the price breaks down through the 1.2602 support level and fixes below, the uptrend will likely be broken.


