
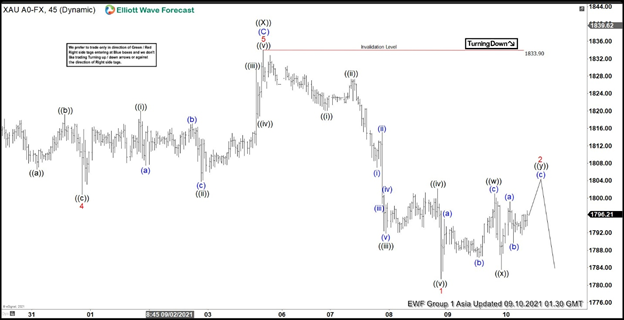
Short-term Elliott wave view in Gold suggests that the cycle from 03 Sep 2021 high is unfolding as a (A), (B), and (C) structure to complete wave ((Y)). The correction remains incomplete favoring more downside extension. Down from that high, gold has began the first leg as wave (A) of the 3 swings that we expect lower. This wave (A) is developing as an impulse structure in lesser degree where wave ((i)) of 1 ended at 1821.49. Pullback in wave ((ii)) of 1 ended at 1827.34 high. Wave ((iii)) of 1 continue lower and ended at 1792.45 low. Then wave ((iv)) of 1 bounce finished at 1802.31 and drop to 1782.48 ended wave ((v)) of 1.
Near-term, as far as the drop remains below wave ((X)) high at 1833.90, expect XAUUSD to extend lower. Currently, we are developing wave 2 as a double correction. Wave ((w)) of 2 already ended at 1801.07. Wave ((x)) connector ended at 1783.92 and bounce to look for complete wave ((y)) of 2. This wave 2 should continue to the upside to 1082.62 – 1814.14 (100.0% – 161.8% fib extension) area to complete wave ((y)) and wave 2 before continue falling in wave 3 of (A) of ((Y)).
Gold 45 minutes Elliott Wave chart


")


