
The EUR/USD currency pair
Technical indicators of the currency pair:
Prev Open: 1.1724
Prev Close: 1.1725
% chg. over the last day: +0.01%
Germany’s house price index fell slightly in August despite the ECB flooding the economy with cheap money. But the situation is likely to start to change soon. The ECB will also start to reduce its asset purchase program to prevent the acceleration of inflation, which promises to be even higher amid Europe’s energy problems.
Trading recommendations
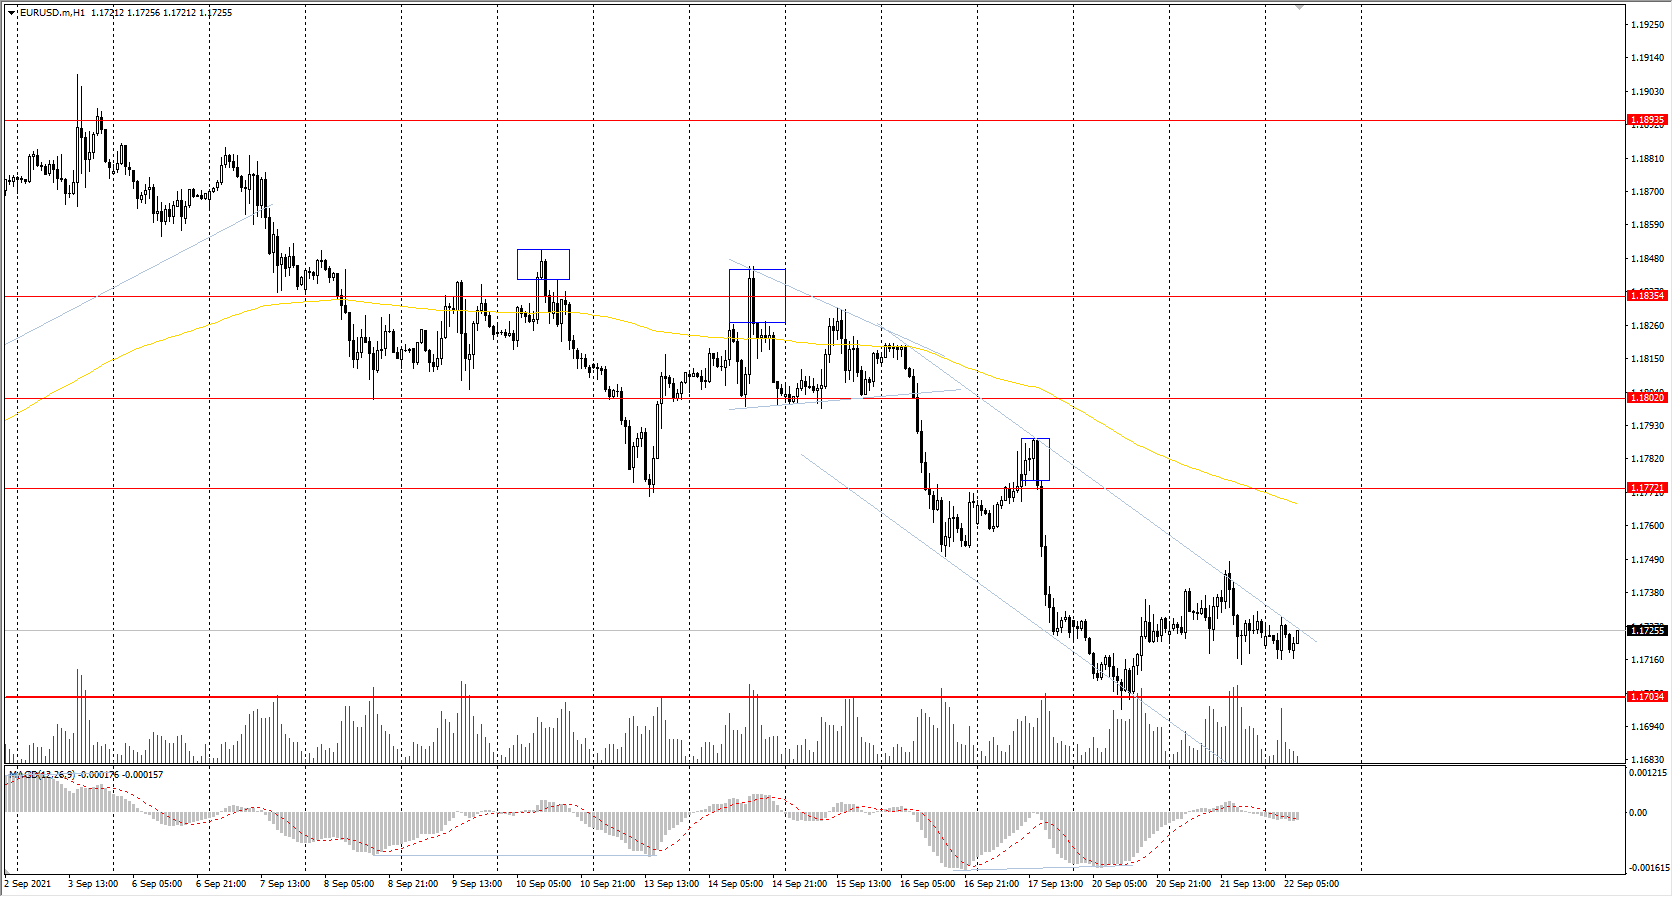
Support levels: 1.1704, 1.1620
Resistance levels: 1.1772, 1.1802, 1.1835, 1.1894, 1.1934, 1.1969
From the technical point of view, the general trend of the EUR/USD currency pair is bullish. The price is trading near the priority change level. The MACD indicator has become inactive. Most likely, the situation will not change much until the Fed meeting today. Under such market conditions, buy deals can be considered after the breakout of the local downtrend line. This is where buyers show initiative. It is best to look for sell trades throughout the day, from the resistance zone near the moving average or after the breakdown of priority change level.
Alternative scenario: if the price breaks down through the 1.1704 support level and fixes below, the mid-term uptrend will likely be broken.
News feed for 2021.09.22:
- US Existing Homes Sales (m/m) at 17:00 (GMT+3);
- US FOMC Economic Projections at 21:00 (GMT+3);
- US FOMC Meeting Minutes at 21:00 (GMT+3);
- US Fed Interest Rate Decision at 21:00 (GMT+3);
- US FOMC Press Conference at 21:30 (GMT+3).
The GBP/USD currency pair
Technical indicators of the currency pair:
Prev Open: 1.3645
Prev Close: 1.3659
% chg. over the last day: +0.10%
The most serious labor shortage in the British labor market has been caused by the fact that employers are trying to hire low-paid workers, while the number of vacancies in other areas is 10% lower than pre-pandemic levels. Interest payments on the UK government debt hit a record high after rising inflation.
Trading recommendations
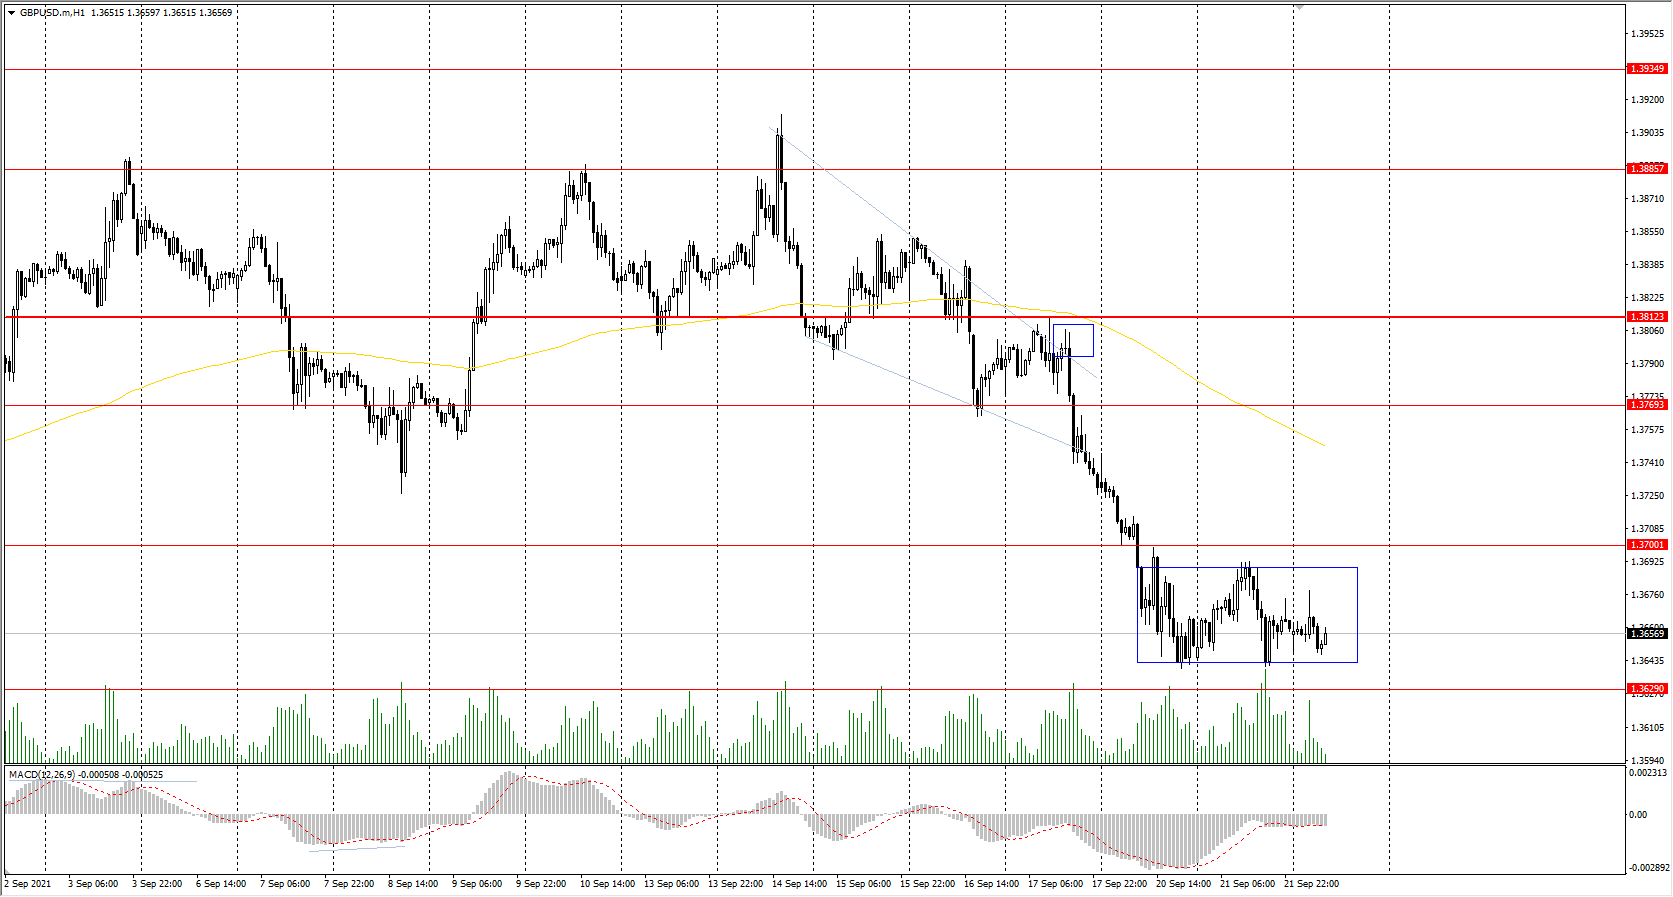
Support levels: 1.3629, 1.3614, 1.3525
Resistance levels: 1.3701, 1.3769, 1.3812, 1.3886, 1.3935, 1.4002
On the hourly time frame, the GBP/USD trend changed to bearish. The GBP/USD currency pair is under sellers’ pressure now, but there are signs that the sell-off is slowing down. Ahead of the FOMC meeting, the price is trading in a small corridor. Under such market conditions, it is better to look for sell trades from the resistance levels after the price gains a foothold below. Buy deals should be considered only intraday and only with short targets after the price exits the balance upwards.
Alternative scenario: if the price breaks out through the 1.3812 resistance level and consolidates above, the bullish scenario will likely resume.
The USD/JPY currency pair
Technical indicators of the currency pair:
Prev Open: 109.38
Prev Close: 109.21
% chg. over the last day: -0.16%
The Bank of Japan kept its negative interest rates and asset purchase targets unchanged amid pressure on the economy related to Covid and the upcoming prime minister elections. The central bank also released more details about its green lending program planned for December.
Trading recommendations
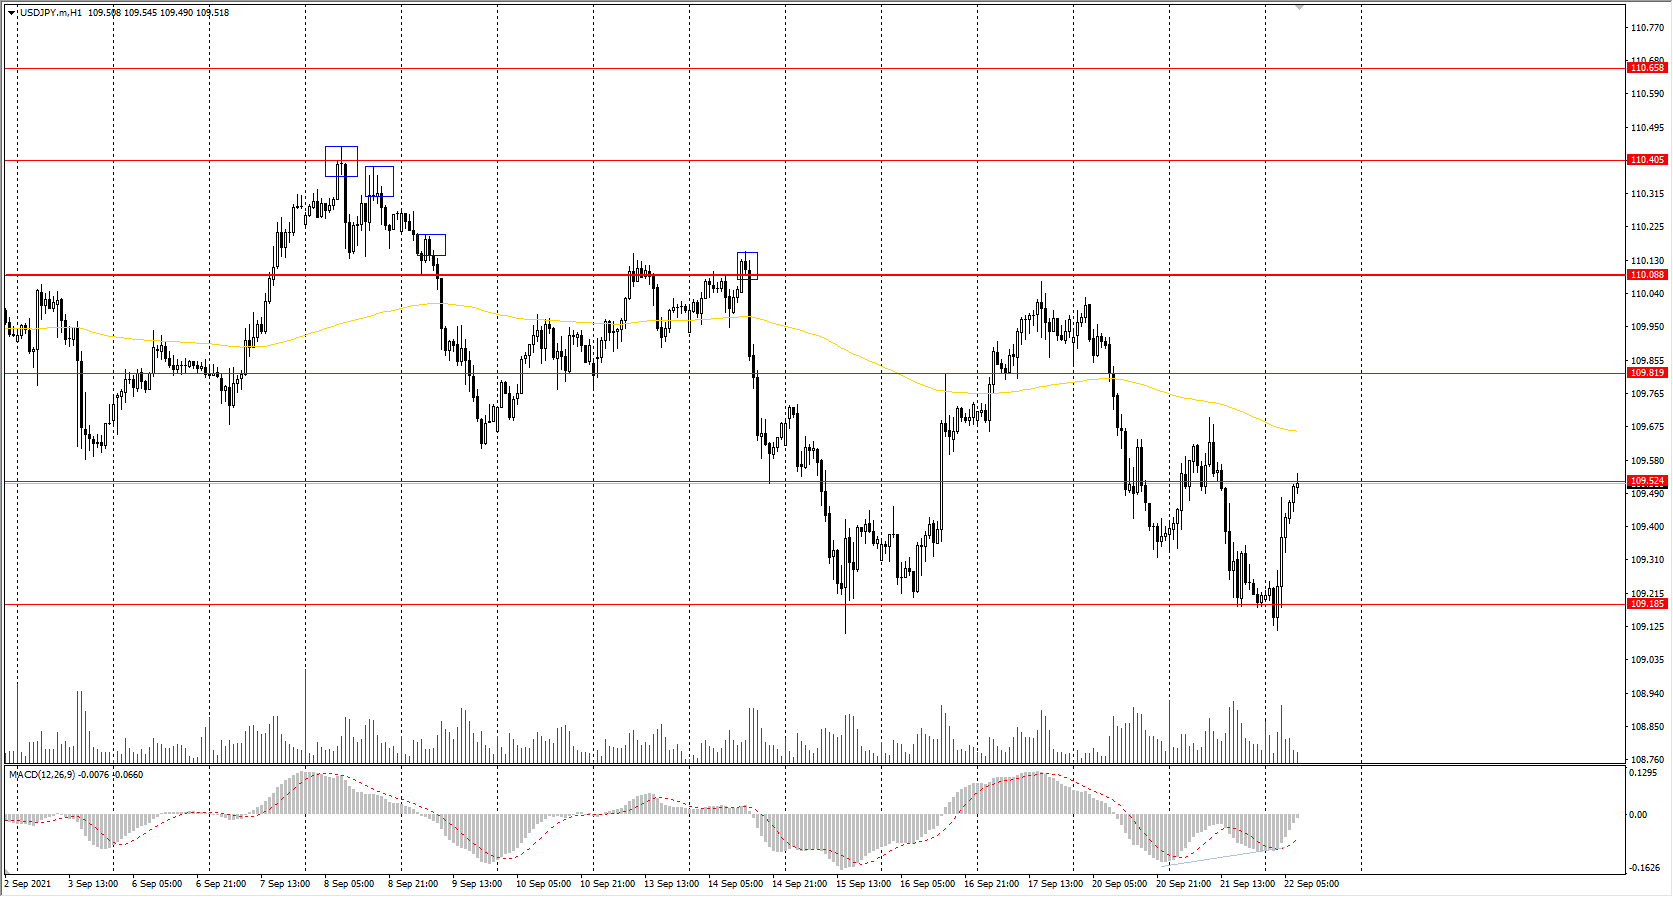
Support levels: 109.18, 108.65
Resistance levels: 109.52, 109.82, 110.09, 110.40, 110.66, 110.95
The main trend of the USD/JPY currency pair is bearish. Due to the fact that the Bank of Japan did not cut its easing program, the Japanese Yen lost some of its positions. As a result, USD/JPY increased at the opening of trading today. The MACD indicator is in the negative zone, but there are weak signs of buying. Under such market conditions, traders should look for sell positions from the resistance level near the moving average. Only intraday buy positions from the support levels should be considered, where there is an initiative of buyers.
Alternative scenario: if the price rises above 110.09, the uptrend is likely to resume.
News feed for 2021.09.22:
- BOJ Monetary Policy Statement at 05:00 (GMT+3);
- BOJ Press Conference at 06:00 (GMT+3);
- BoJ Interest Rate Decision at 06:04 (GMT+3).
The USD/CAD currency pair
Technical indicators of the currency pair:
Prev Open: 1.2824
Prev Close: 1.2811
% chg. over the last day: -0.10%
The Canadian dollar is a commodity currency, so the USD/CAD currency pair is highly dependent on the dynamics of the dollar index and oil prices. Neither the dollar index nor oil showed any dynamics yesterday. As a result, the price of USD/CAD is trading flat. Crude Oil Inventories are expected today, which may trigger the movement on the currency pair. According to the election results, Canadian Prime Minister Justin Trudeau will remain in power but will not get the majority in Parliament, which he strongly hoped for.
Trading recommendations
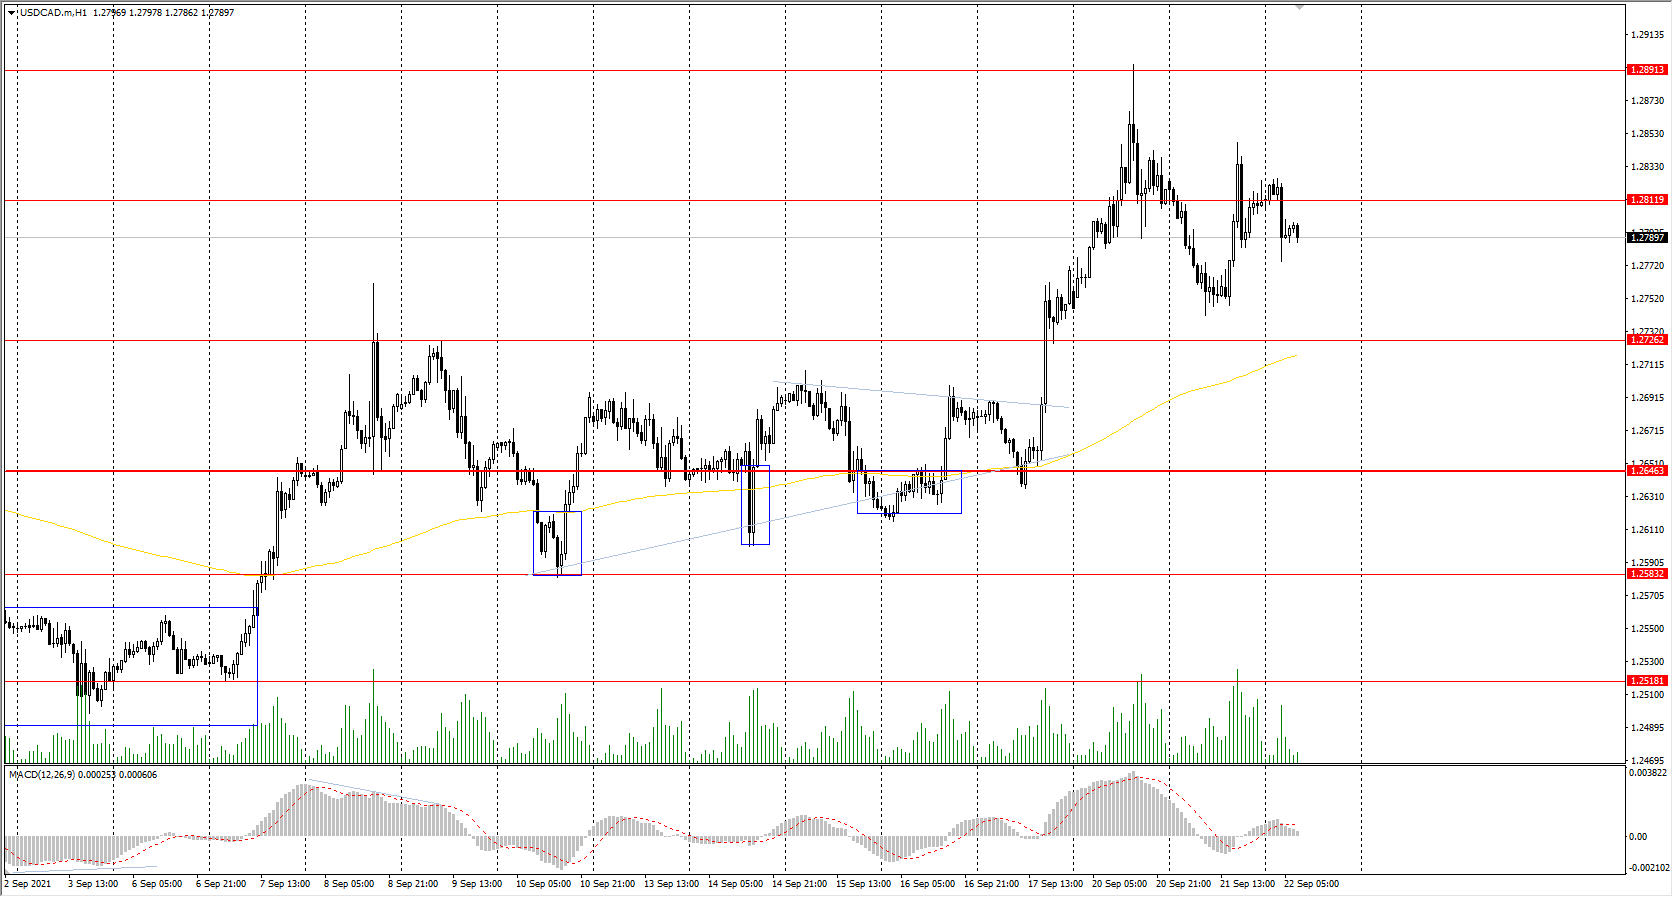
Support levels: 1.2726, 1.2646, 1.2583, 1.2518, 1.2425
Resistance levels: 1.2812, 1.2891, 1.2951
From the technical point of view, the situation is uncertain, but there is a slight dominance of upward movement. The MACD indicator is inactive. The MACD indicator has become inactive too. Under such market conditions, it is better to trade within the local trend, which is obviously bullish. It is best to look for buy trades from the support levels near the moving average. There are no optimal entry points for sell positions now.
Alternative scenario: if the price breaks down through the 1.2646 support level and fixes below, the uptrend will likely be broken.
News feed for 2021.09.22:
- US Crude Oil Inventories (w/w) at 17:30 (GMT+3).


