
The EUR/USD currency pair
Technical indicators of the currency pair:
Prev Open: 1.1598
Prev Close: 1.1556
% chg. over the last day: -0.36%
The data from ADP showed that US private sector employment increased by 568,000 jobs beating analysts’ expectations. Eurozone retail sales increased by 0.3% in August compared to a 2.6% decline in July. Economists forecast an increase of 0.8% in August. German factory orders fell sharply by 7.7% month-over-month.
Trading recommendations
Support levels: 1.1502, 1.1453
Resistance levels: 1.1583, 1.1671, 1.1717, 1.1772, 1.1802, 1.1835
From the technical point of view, the EUR/USD trend is bearish. Yesterday, the price went down sharply again. The MACD indicator shows divergence on the higher timeframes. Under such market conditions, traders should consider sell deals from the resistance levels near the moving average, as the price has deviated from the middle line. Buy trades should be considered only from the support levels with additional confirmation in the form of a buyers’ initiative.
Alternative scenario: if the price breaks out through the 1.1717 resistance level and fixes above, the mid-term uptrend will likely resume.

News feed for 2021.10.07:
- German Industrial Production (m/m) at 09:00 (GMT+3);
- Publication of the Eurozone ECB Account of Monetary Policy Meeting at 14:30 (GMT+3);
- US Initial Jobless Claims (w/w) at 15:30 (GMT+3).
The GBP/USD currency pair
Technical indicators of the currency pair:
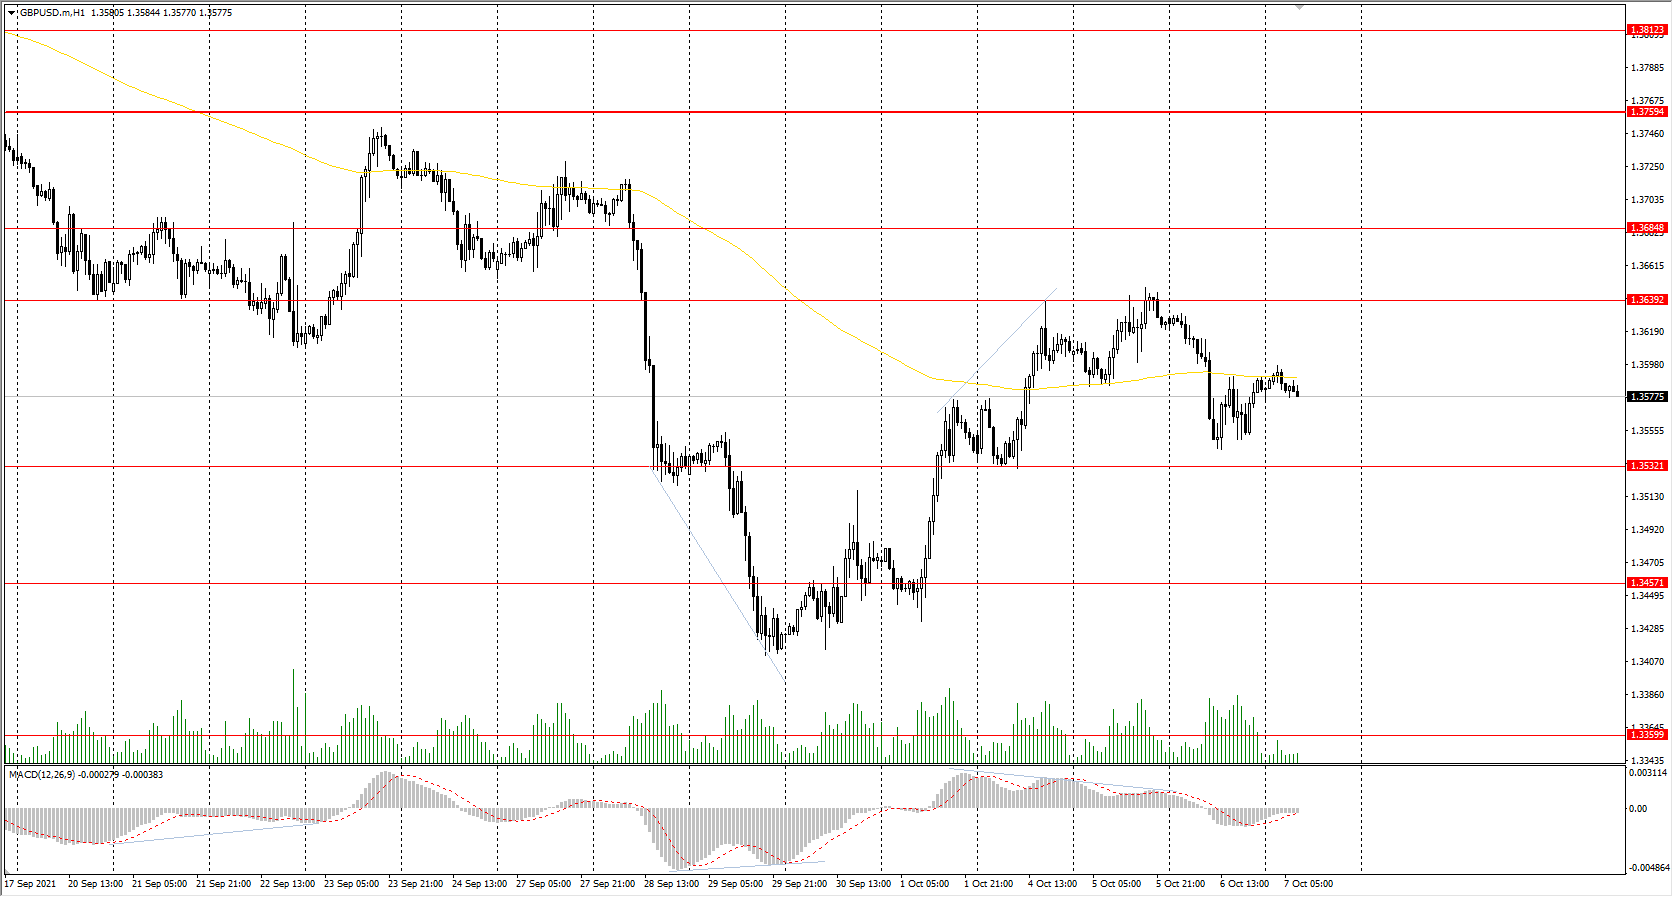
Prev Open: 1.3627
Prev Close: 1.3582
% chg. over the last day: -0.33%
Inflation expectations in the UK have reached a 13-year high. The 10-year breakeven rate reached 4%, which is twice the target of the Bank of England. The increase came on the back of a record rise in UK gas prices this week. The growth of the construction sector also slowed down in September.
Trading recommendations
Support levels: 1.3532, 1.3457, 1.3360, 1.3282
Resistance levels: 1.3639, 1.3685, 1.3759, 1.3812, 1.3886
On the hourly time frame, the GBP/USD trend is bearish. The British currency looks more confident than the euro, due to a direct correlation with oil prices. The MACD indicator has become inactive. Buy trades should be considered only throughout the day and only with short targets from the support levels after the buyer’s initiative. Sell trades can be found at the resistance levels near the moving average line.
Alternative scenario: if the price breaks out through the 1.3759 resistance level and consolidates above, the bullish scenario will likely resume.
The USD/JPY currency pair
Technical indicators of the currency pair:
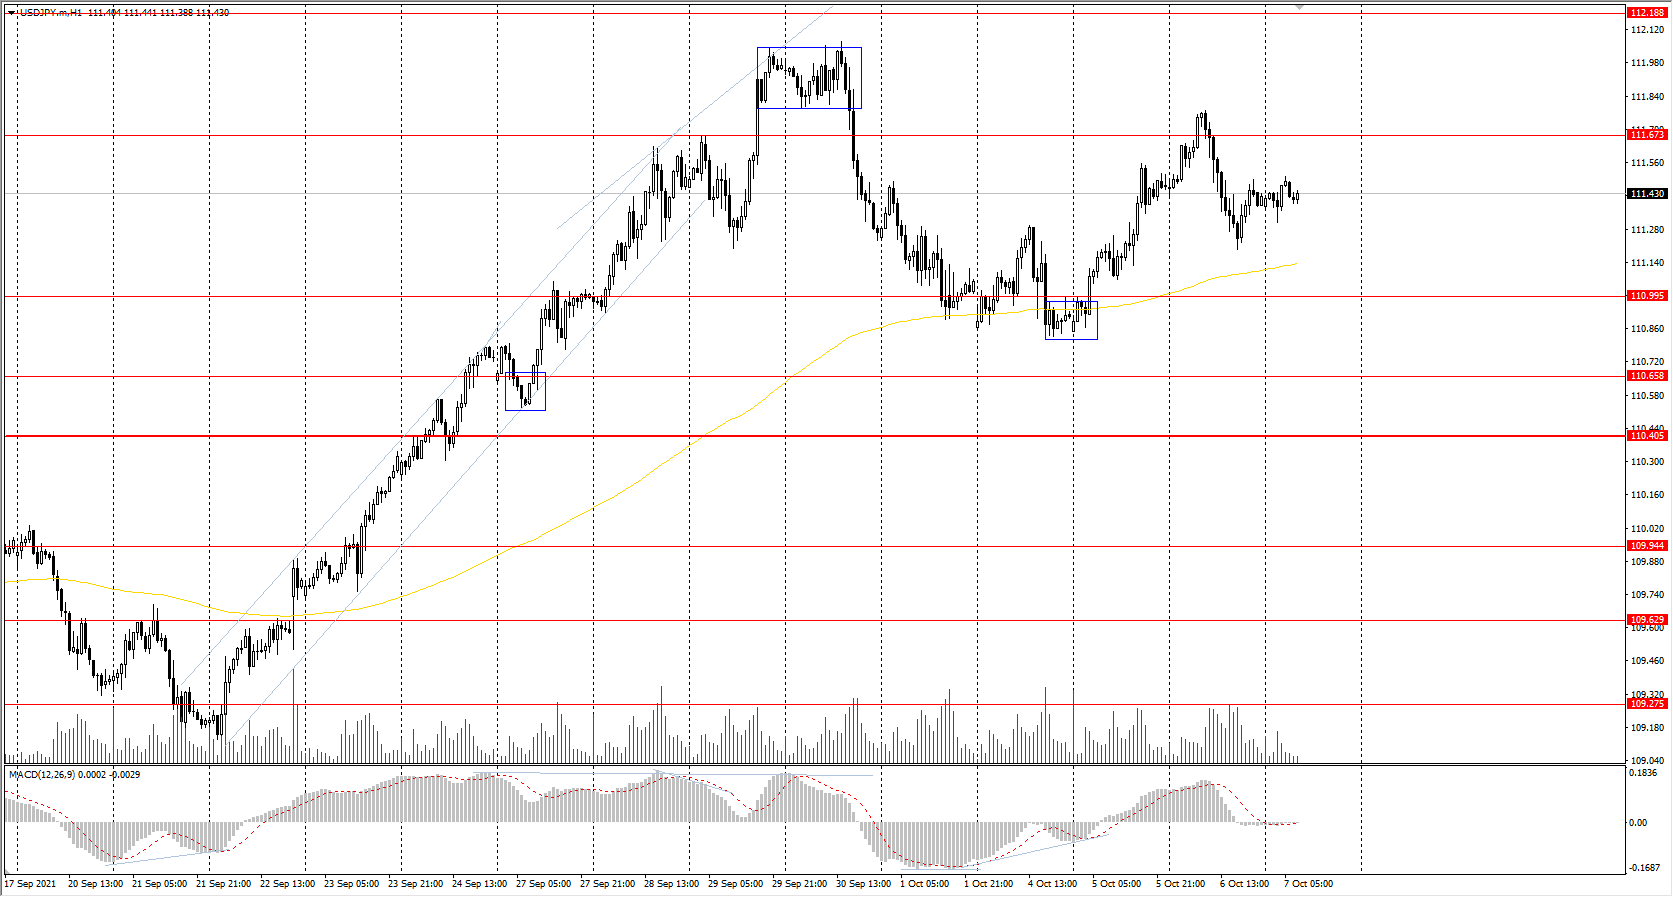
Prev Open: 111.46
Prev Close: 111.41
% chg. over the last day: -0.04%
The Japanese yen is highly correlated with the dollar index. The dollar index is growing fundamentally, which contributes to the growth of USD/JPY quotes.
Trading recommendations
Support levels: 110.99, 110.65, 110.40, 109.95, 109.63, 109.27
Resistance levels: 111.67, 112.19
The main trend of the USD/JPY currency pair is bullish. The MACD indicator has become inactive, the price begins trading flat. Under such market conditions, it’s better to look for buy positions from the support levels near the moving average. Sell positions should be considered only throughout the day from the resistance levels, given there is sellers’ initiative.
Alternative scenario: if the price falls below 110.45, the uptrend is likely to be broken.
The USD/CAD currency pair
Technical indicators of the currency pair:
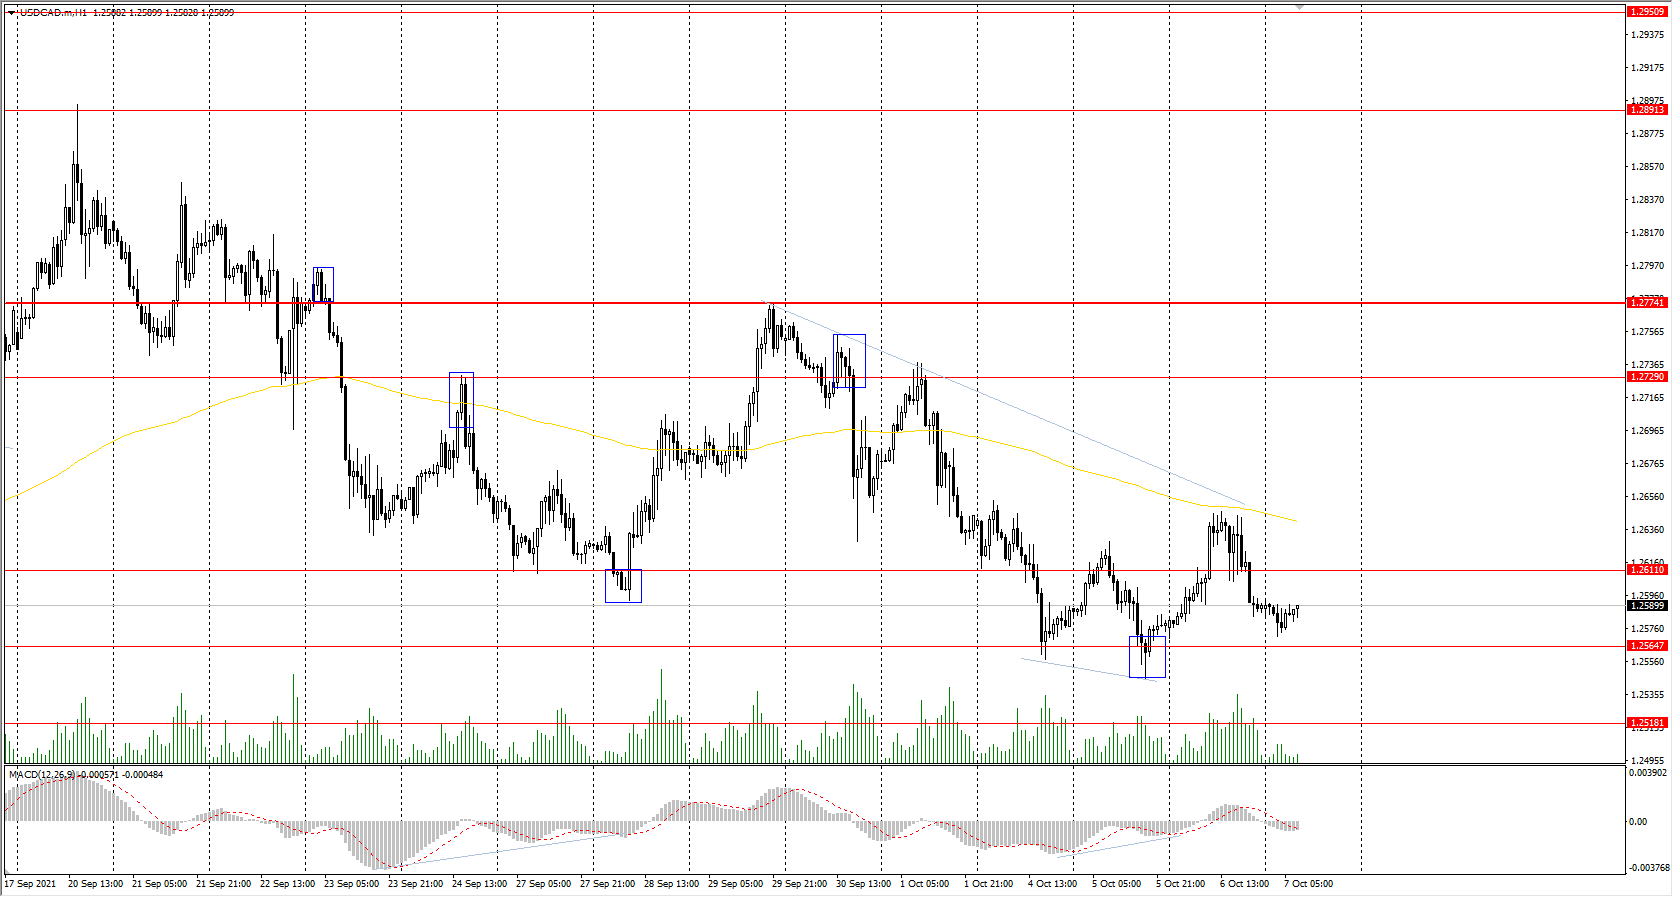
Prev Open: 1.2576
Prev Close: 1.2590
% chg. over the last day: +0.11%
The Canadian dollar is a commodity currency, so USD/CAD is highly dependent on the dynamics of the dollar index and oil prices. The dollar index was slightly stronger yesterday, while oil prices decreased. As a result, the USD/CAD quotes have slightly increased, but the price is still trading in a wide flat.
Trading recommendations
Support levels: 1.2565, 1.2518, 1.2425
Resistance levels: 1.2611, 1.2729, 1.2774, 1.2891
From the technical point of view, the trend of the USD/CAD currency pair is bearish. But the MACD indicator is showing the divergence in the direction of buying. Under such market conditions, it is better to look for sell deals from the resistance levels near the moving average. Buy deals should be considered from the false breakdown zone but with short targets.
Alternative scenario: if the price breaks out through the 1.2774 resistance level and fixes above, the uptrend will likely resume.
News feed for 2021.10.07:
- Canada Ivey PMI (m/m) at 17:00 (GMT+3);
- Canada BoC Gov Tiff Macklem’s Speech at 19:00 (GMT+3).


