Contributors Technical Analysis Elliott Wave Analysis: Oil May Slow Down at 80-82 Area

Elliott Wave Analysis: Oil May Slow Down at 80-82 Area

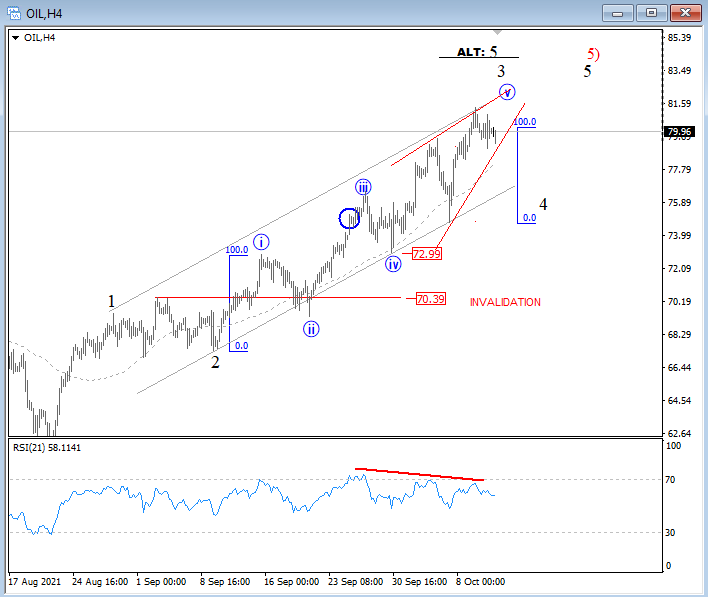
After yesterday’s intraday shake out, Crude oil looks corrective on the intraday basis, which means that it can retest the highs and 82-83 area, ideally as part of final leg of an ending diagonal pattern before it finds the resistance.

Crude oil is still at the highs in the 4-hour chart and five-wave cycle looks to be unfinished, so we may see more gains within wave 3 or alternatively wave 5, but wave “v” of 3 or 5 looks to be an ending diagonal pattern, so still watch out for a reversal down here in the 80-82 area, at least in three waves back to 73 support area. A bigger decline back to 70 area is needed to confirm the top.

Crude oil 4h Elliott Wave analysis chart

Previous articleUS: Inflation Pressures Remain High in September CPI
Next articleEuro Edges Closer to 1.16
ElliottWave-Forecast has built its reputation on accurate technical analysis and a winning attitude. By successfully incorporating the Elliott Wave Theory with Market Correlation, Cycles, Proprietary Pivot System, we provide precise forecasts with up-to-date analysis for 52 instruments including Forex majors & crosses, Commodities and a number of Equity Indices from around the World. Our clients also have immediate access to our proprietary Actionable Trade Setups, Market Overview, 1 Hour, 4 Hour, Daily & Weekly Wave Counts. Weekend Webinar, Live Screen Sharing Sessions, Daily Technical Videos, Elliott Wave Setup videos, Educational Resources, and 24 Hour chat room where they are provided live updates and given answers to their questions.

NO COMMENTS

LEAVE A REPLY

Please enter your comment!
Please enter your name here

Exit mobile version