
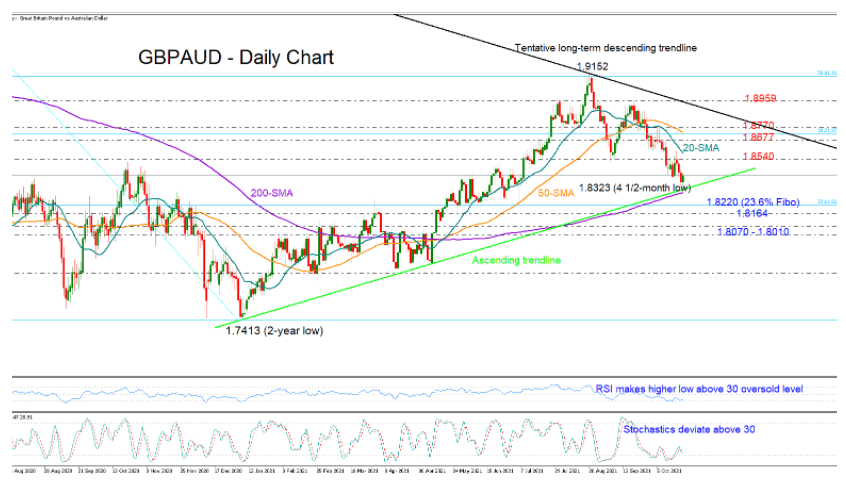
GBPAUD is in the fifth week of declines but hopes for a bullish transition are currently growing large as the price is challenging the key ascending trendline drawn from January’s lows and the 200-day simple moving average (SMA) at 1.8323.
Although the bearish intersection between the 20- and 50-day SMAs keeps promoting the negative trajectory in the short-term picture, the pair seems to have already met oversold conditions according to the momentum indicators; the RSI is charting a higher low above its 30 oversold level, while the Stochastics are also trending higher after bottoming out below 20.
Looking for resistance levels, the 1.8540 restrictive territory could apply some downside pressures to upside corrections with the help of the 20-day SMA at 1.8580. Crawling higher, the price may get congested somewhere between the 1.8677 barrier and the 50-day SMA at 1.8727, while not far above, a close on top of the swing high of 1.8770 could debunk another extension up to the tentative descending trendline stretched from the 2020 top of 2.084.
Should the supportive trendline crack, selling pressures could temper towards the 1.8220 – 1.8165 region. The pair has been frequently testing that territory over the past two years, and the 23.6% Fibonacci retracement of the 2020 – 2021 downtrend is also in the neighborhood. Therefore, any close lower from here could step up bearish actions likely towards the 1.8070 – 1.8010 zone.
In brief, GBPAUD has the potential for an upside reversal near a crucial supportive trendline. Failure to bounce on that line could add more legs to the ongoing sell-off.


