
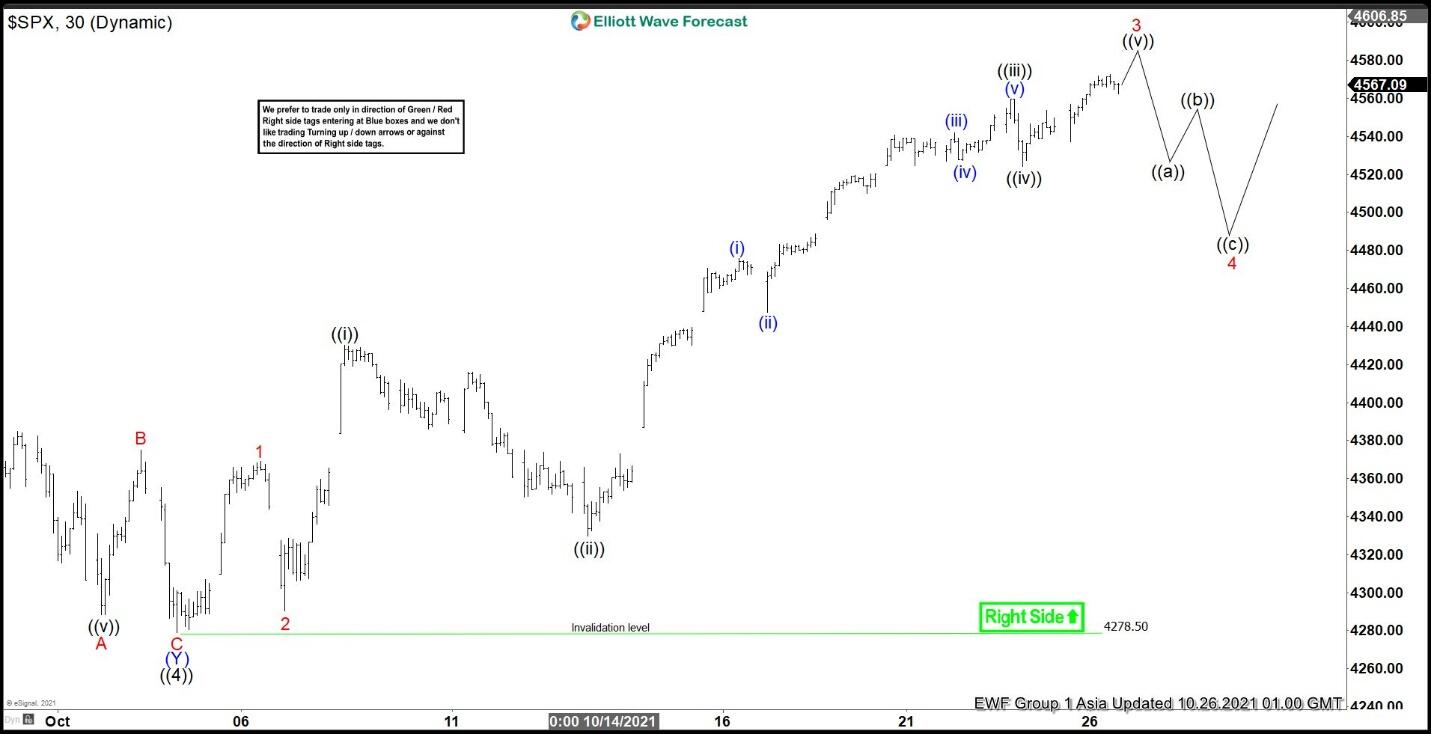
In larger degree context, the rally from October 1, 2021 low in S&P 500 Futures (ES) is unfolding as a 5 waves impulse Elliott Wave structure. Up from October 1 low, wave 1 ended at 4365.75 and pullback in wave 2 ended at 4267.50. Wave 3 is in progress with internal subdivision as a 5 waves in lesser degree. Up from wave 2 low, wave ((i)) ended at 4421.50 and wave ((ii)) pullback ended at 4316.90.
The 1 hour chart below shows wave ((ii)) as the starting point. Up from there, wave ((iii)) ended at 4551.50 and pullback in wave ((iv)) ended at 4515.25. Expect the Index to end wave ((v)) soon with a few more marginal highs, then it should complete wave 3 in higher degree. The Index should then pullback in wave 4 to correct cycle from October 5 low before the rally resumes again. Pullback in wave 4 should unfold in 3, 7, or 11 swing. In the 1 hour chart below, we show a simple 3 waves zigzag pullback as the internal subdivision. Near term, as far as wave ((ii)) low pivot at 4316.90, expect pullback to find support in 3, 7, or 11 swing for further upside.
S&P 500 Futures (ES) 60 Minutes Elliott Wave Chart


