
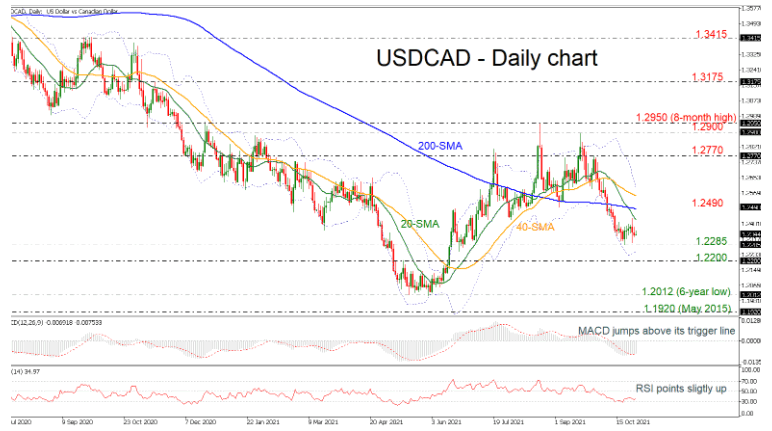
USDCAD has been moving sideways over the last few days, remaining above the 1.2285 support and below the simple moving averages (SMAs).
Technically, the MACD oscillator is jumping above its trigger line, holding well below the zero level, while the RSI is pointing marginally up in the negative territory.
If the price extends the move up, immediate resistance could come from the 200-day SMA, which overlaps with the 1.2490 barrier. Climbing higher, the 40-day SMA at 1.2555 may halt the bullish actions before meeting the upper Bollinger band around 1.2595. Overcoming these obstacles, the price could open the way for further upside move until the 1.2770 resistance.
However, a decline beneath the 1.2285 hurdle, it could reach the lower Bollinger band at 1.2245 ahead of the 1.2200 psychological mark. Steeper decreases could take the bears until the six-year low of 1.2012.
In conclusion, USDCAD has been in a downward wave in the short-term and if there are more falling moves below the lower Bollinger band could endorse the negative scenario.


