
The EUR/USD currency pair
Technical indicators of the currency pair:
Prev Open: 1.1552
Prev Close: 1.1567
% chg. over the last day: +0.13%
Europe is again in the epicenter of the COVID-19 Pandemic. According to the WHO, hospitalizations of patients with Covid-19 have more than doubled in just one week, with cases approaching record levels due to the more infectious Delta strain. All of this could lead to new quarantine restrictions in European countries, undoubtedly leading to lower economic numbers.
Trading recommendations
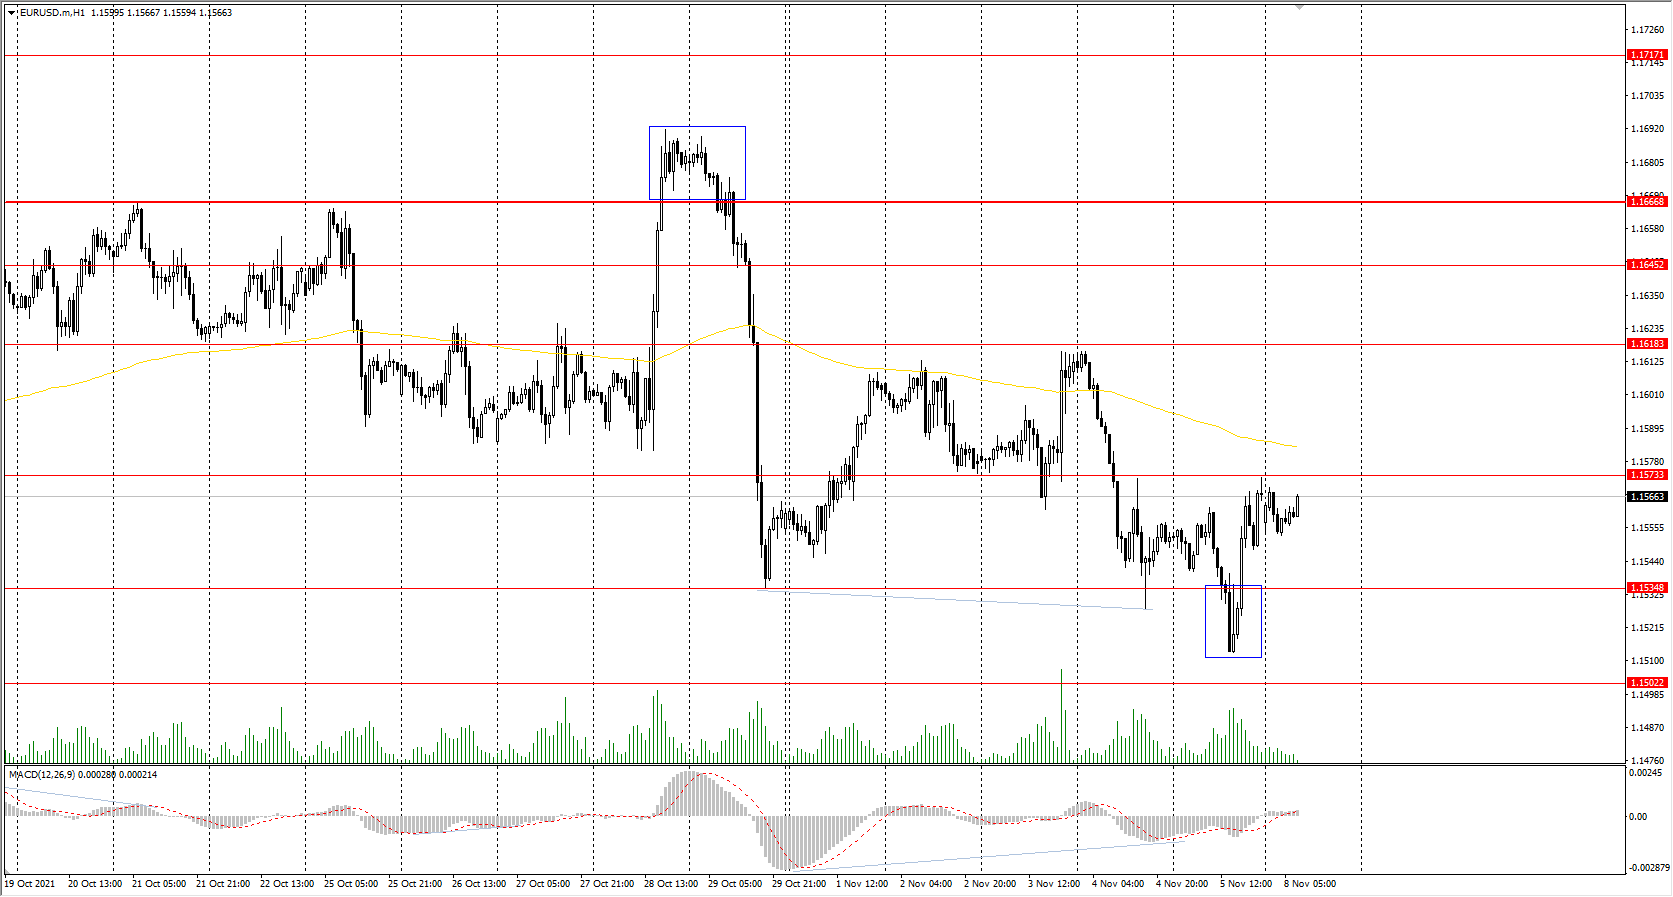
Support levels: 1.1535, 1.1502, 1.1453
Resistance levels: 1.1573, 1.1618, 1.1645, 1.1667, 1.1717, 1.1772
From the technical point of view, the EUR/USD on the hour time frame is bearish. But the price managed to return above the breakdown level, which indicates a possible false break move. The MACD indicator also shows a divergence. Under such market conditions, traders should consider sell positions from the resistance levels near the moving average. It is best to look for buy trades from the false breakdown zone.
Alternative scenario: if the price breaks out through the 1.1667 resistance level and fixes above, the mid-term uptrend will likely resume.
News feed for 2021.11.08:
- US FOMC Member Clarida’s Speech at 16:00 (GMT+2);
- US FED Chair Powell’s Speech at 17:30 (GMT+2);
- US FOMC Member Williams’s Speech at 17:55 (GMT+2);
- US FOMC Member Bowman’s Speech at 19:00 (GMT+2);
- US FOMC Member Evans’s Speech at 20:50 (GMT+2).
The GBP/USD currency pair
Technical indicators of the currency pair:
Prev Open: 1.3496
Prev Close: 1.3494
% chg. over the last day: -0.01%
The British pound is under intense selling pressure after the central bank of England did not tighten its monetary policy. Before the meeting, analysts were sure that it would happen, and the Governor of the Bank of England said that such a possibility existed. The British currency is now looking less confident than the Euro. The British pound may be supported only by the growing Brent oil quotes, as these two instruments are historically correlated.
Trading recommendations
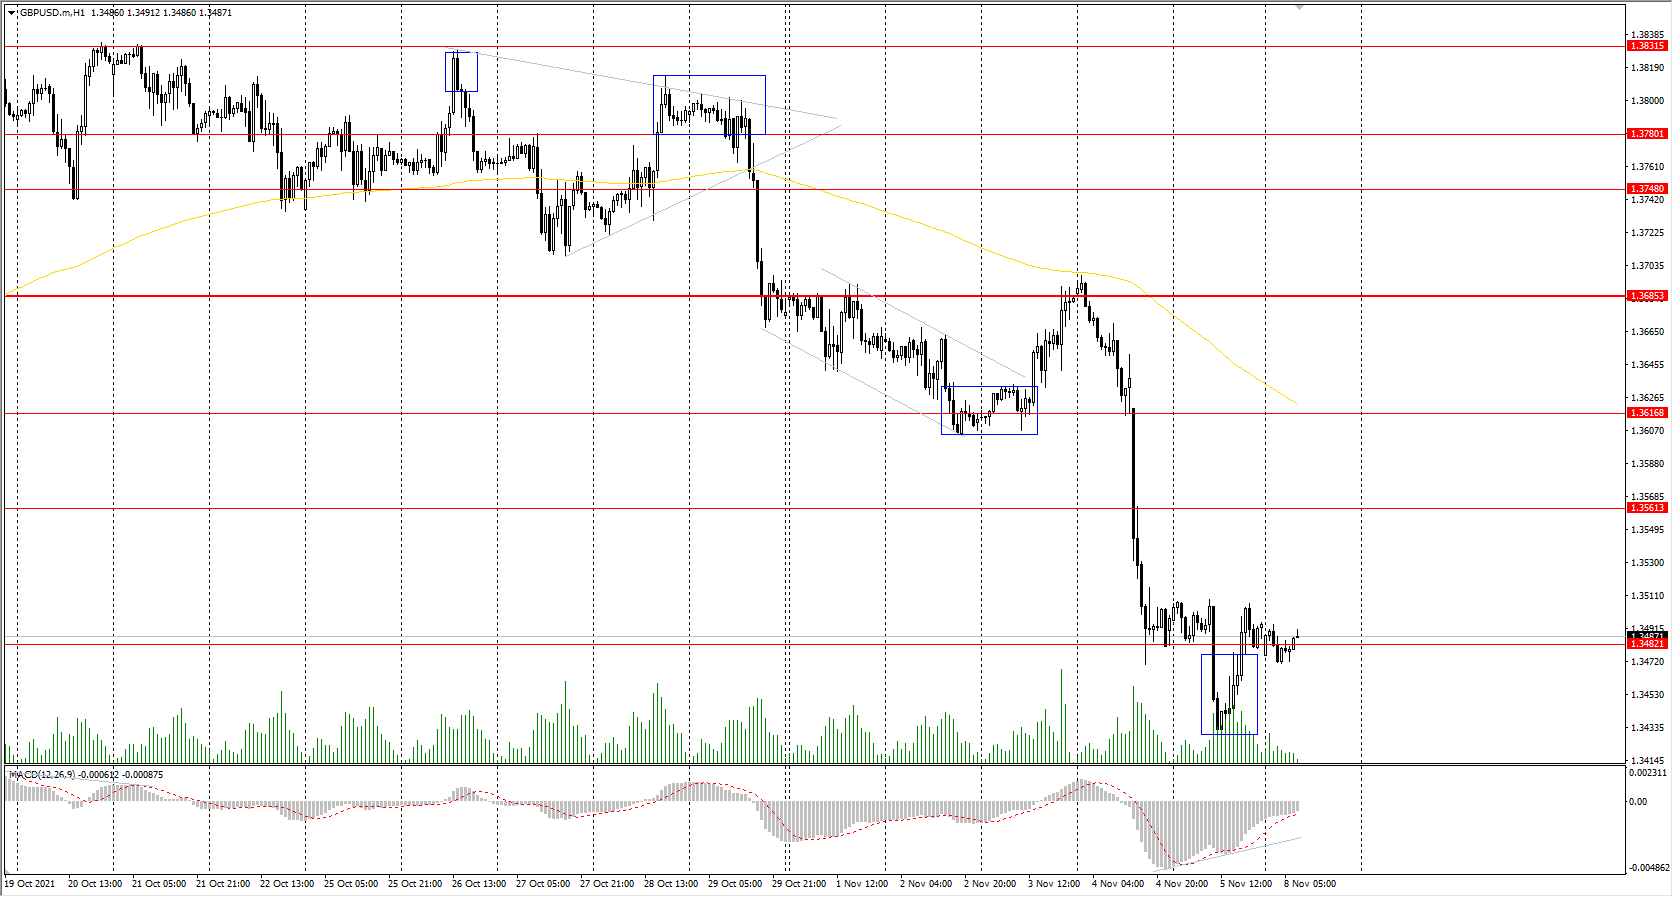
Support levels: 1.3482, 1.3360
Resistance levels: 1.3562, 1.3616, 1.3685, 1.3748, 1.3780, 1.3831, 1.3886
On the hourly time frame, the trend on GBP/USD is bearish. The MACD indicator is in the negative zone, but there are signs of divergence. After Friday’s false breakdown, traders can look for buy trades on the lower time frames with the expectation of a technical rebound. It is best to look for sell deals from the resistance levels around the moving average, as prices have deviated strongly from the averages.
Alternative scenario: if the price breaks out through the 1.3685 resistance level and consolidates above, the bullish scenario will likely resume.
News feed for 2021.11.08:
- US FOMC Member Clarida’s Speech at 16:00 (GMT+2);
- US FED Chair Powell’s Speech at 17:30 (GMT+2);
- US FOMC Member Williams’s Speech at 17:55 (GMT+2);
- US FOMC Member Bowman’s Speech at 19:00 (GMT+2);
- US FOMC Member Evans’s Speech at 20:50 (GMT+2).
The GBP/USD currency pair
Technical indicators of the currency pair:
Prev Open: 1.3496
Prev Close: 1.3494
% chg. over the last day: -0.01%
The British pound is under intense selling pressure after the central bank of England did not tighten its monetary policy. Before the meeting, analysts were sure that it would happen, and the Governor of the Bank of England said that such a possibility existed. The British currency is now looking less confident than the Euro. The British pound may be supported only by the growing Brent oil quotes, as these two instruments are historically correlated.
Trading recommendations
Support levels: 1.3482, 1.3360
Resistance levels: 1.3562, 1.3616, 1.3685, 1.3748, 1.3780, 1.3831, 1.3886
On the hourly time frame, the trend on GBP/USD is bearish. The MACD indicator is in the negative zone, but there are signs of divergence. After Friday’s false breakdown, traders can look for buy trades on the lower time frames with the expectation of a technical rebound. It is best to look for sell deals from the resistance levels around the moving average, as prices have deviated strongly from the averages.
Alternative scenario: if the price breaks out through the 1.3685 resistance level and consolidates above, the bullish scenario will likely resume.
The USD/CAD currency pair
Technical indicators of the currency pair:
Prev Open: 1.2455
Prev Close: 1.2452
% chg. over the last day: -0.02%
The Canadian dollar is a commodity currency, so the USD/CAD currency pair highly depends on the dollar index dynamics and oil prices. On Friday, the dollar index remained at the same level, while oil prices increased by the end of the day. As a result, USD/CAD quotes slightly decreased due to strengthening the Canadian currency. The unemployment rate in Canada fell from 6.9% to 6.7%.
Trading recommendations
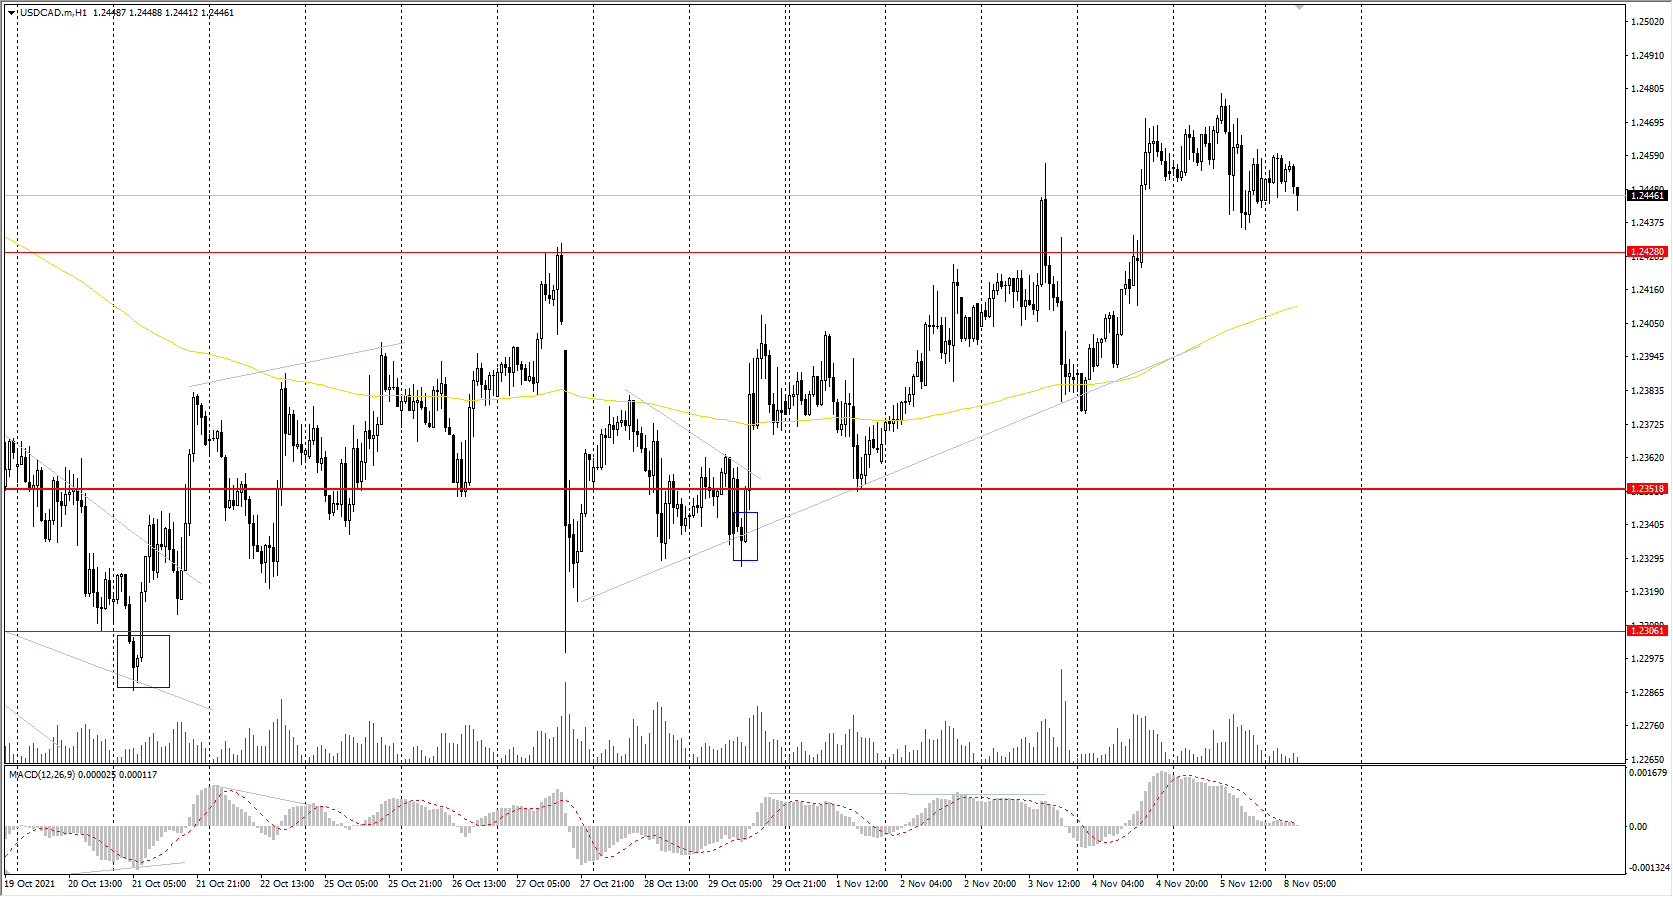
Support levels: 1.2428, 1.2352, 1.2306, 1.2260
Resistance levels: 1.2518, 1.2565, 1.2628, 1.2729, 1.2774
From the technical point of view, the USD/CAD currency trend has changed to bullish. The price broke through the priority change level and consolidated above. The MACD indicator has become inactive, and there are no signs of reversal. Under such market conditions, it is better to look for buy trades from the support levels, given there is the buyers’ initiative. Sell deals should be considered from the resistance levels of the higher time frame.
Alternative scenario: if the price breaks down through the 1.2351 support level and fixes below, the downtrend will likely resume.


