
The EUR/USD currency pair
Technical indicators of the currency pair:
Prev Open: 1.1366
Prev Close: 1.1281
% chg. over the last day: -0.75%
With inflation in the Eurozone above 4%, analysts believe that prices in the region will continue to rise, potentially forcing the European Central Bank to raise interest rates by the end of next year. Germany’s producer price index increased to a record high. The euro is under pressure not only because of high inflation but also because of fears of new COVID restrictions in the region.
Trading recommendations
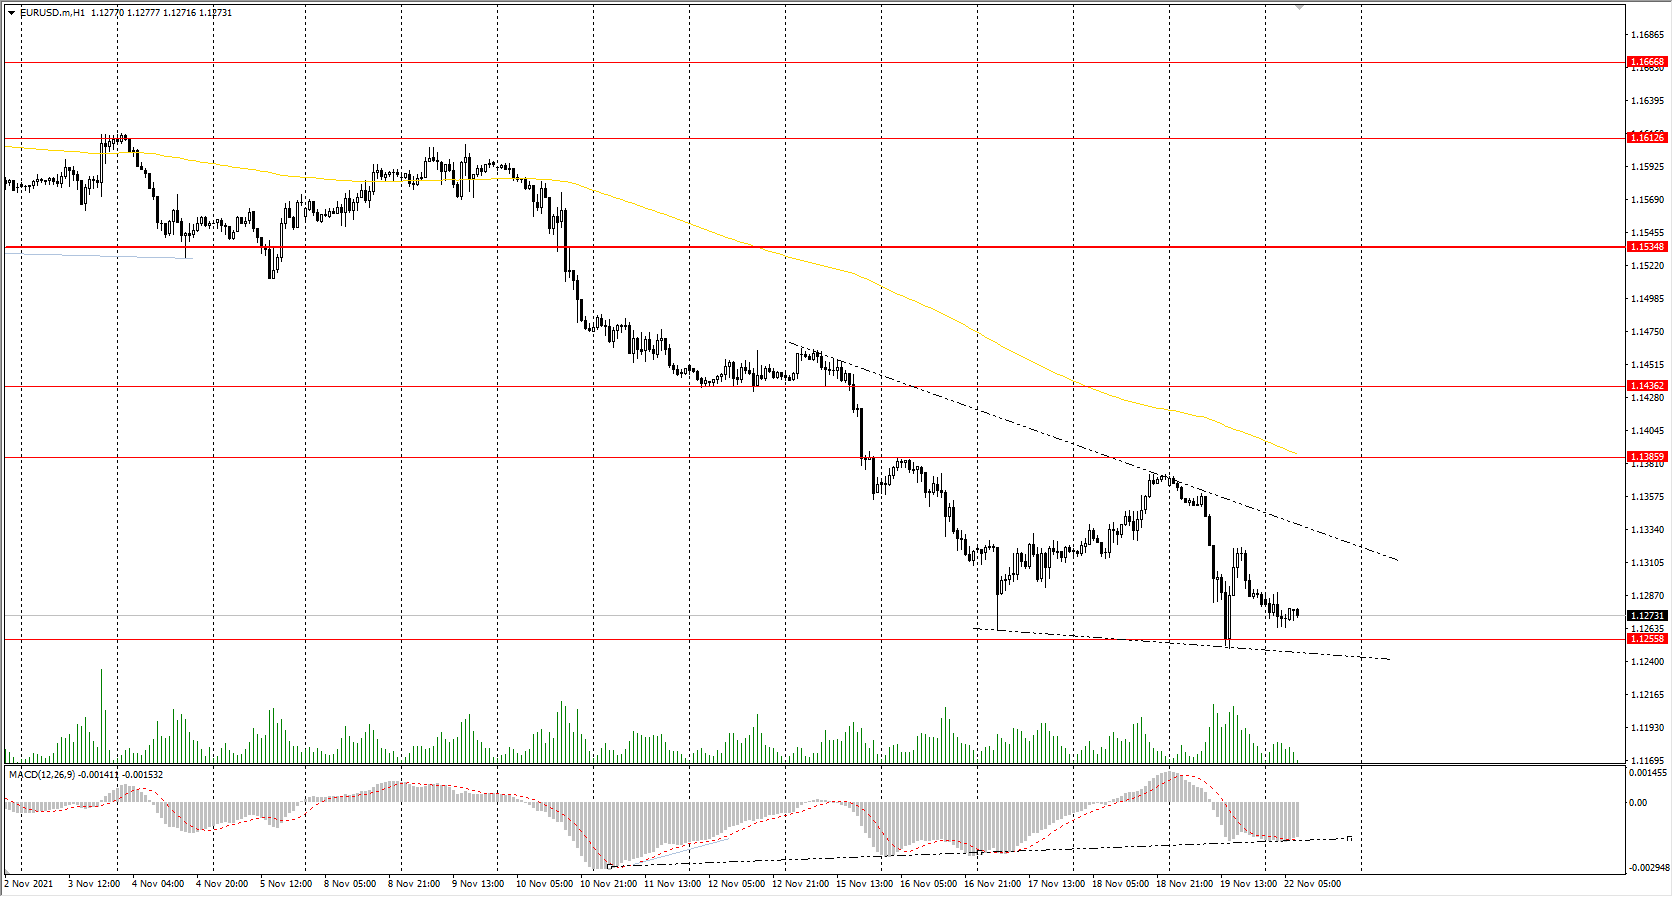
Support levels: 1.1256
Resistance levels: 1.1386, 1.1436, 1.1535, 1.1613, 1.1667, 1.1717
From the technical point of view, the EUR/USD is bearish on the hour time frame. The Euro continues to show weakness. The MACD indicator has become negative again, but the buyers’ pressure is weakening. Under such market conditions, traders should consider sell positions from the resistance levels near the moving average since the price has deviated strongly from the averages. Buy trades should be considered only from the support levels of the higher time frame, given the buyers’ initiative, but only with short targets.
Alternative scenario: if the price breaks out through the 1.1436 resistance level and fixes above, the mid-term uptrend will likely resume.
News feed for 2021.11.22:
- US Existing Home Sales (m/m) at 17:00 (GMT+2).
The GBP/USD currency pair
Technical indicators of the currency pair:
Prev Open: 1.3483
Prev Close: 1.3443
% chg. over the last day: -0.30%
The UK retail sales increased by 0.8% in October; a rise of 0.5% was expected. The British pound is now looking more steady than the euro. More analysts believe that the Bank of England will raise the interest rate at its next meeting.
Trading recommendations
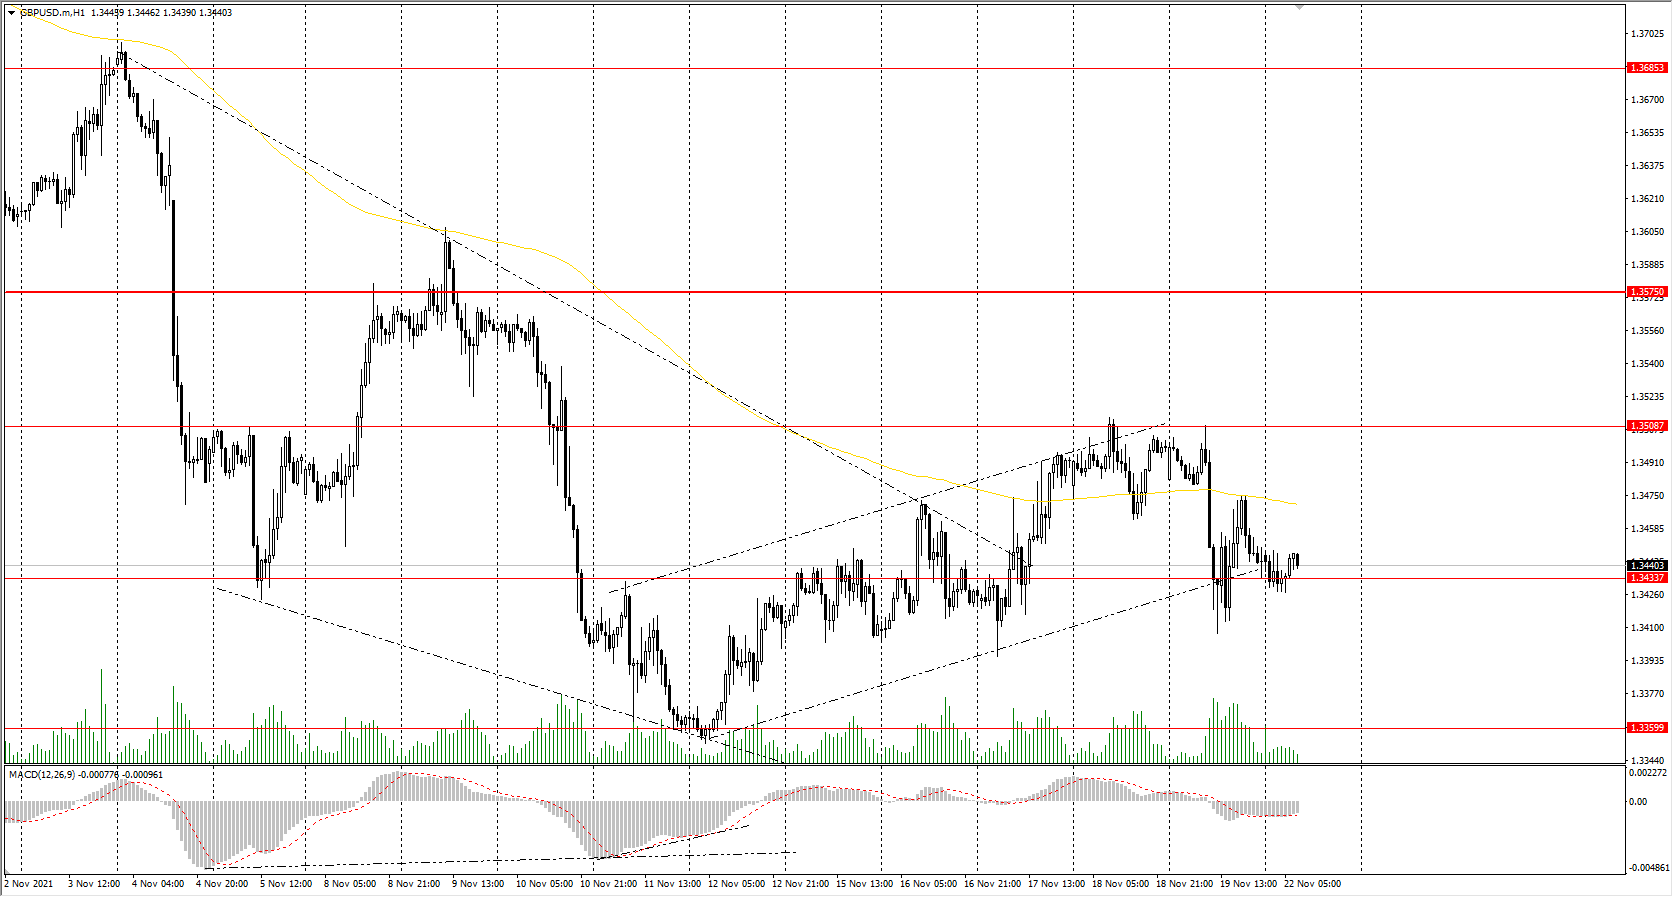
Support levels: 1.3434, 1.3360
Resistance levels: 1.3507, 1.3575, 1.3685, 1.3748
On the hourly time frame, the trend on GBP/USD is bearish. The MACD indicator has become inactive. Under such market conditions, traders should consider sell positions from the priority change level. Buy trades should be considered only from the support levels of the higher time frame, given the buyers’ initiative.
Alternative scenario: if the price breaks out through the 1.3507 resistance level and consolidates above, the bullish scenario will likely resume.
The USD/JPY currency pair
Technical indicators of the currency pair:
Prev Open: 114.25
Prev Close: 114.01
% chg. over the last day: -0.21%
In Japan, there is a sharp decrease in COVID cases. This is a good sign for a complete lifting of restrictions in the near term, which will eventually increase business activity in the country. But because of the ultra-soft monetary policy from the Bank of Japan, the yen will weaken against the US dollar.
Trading recommendations
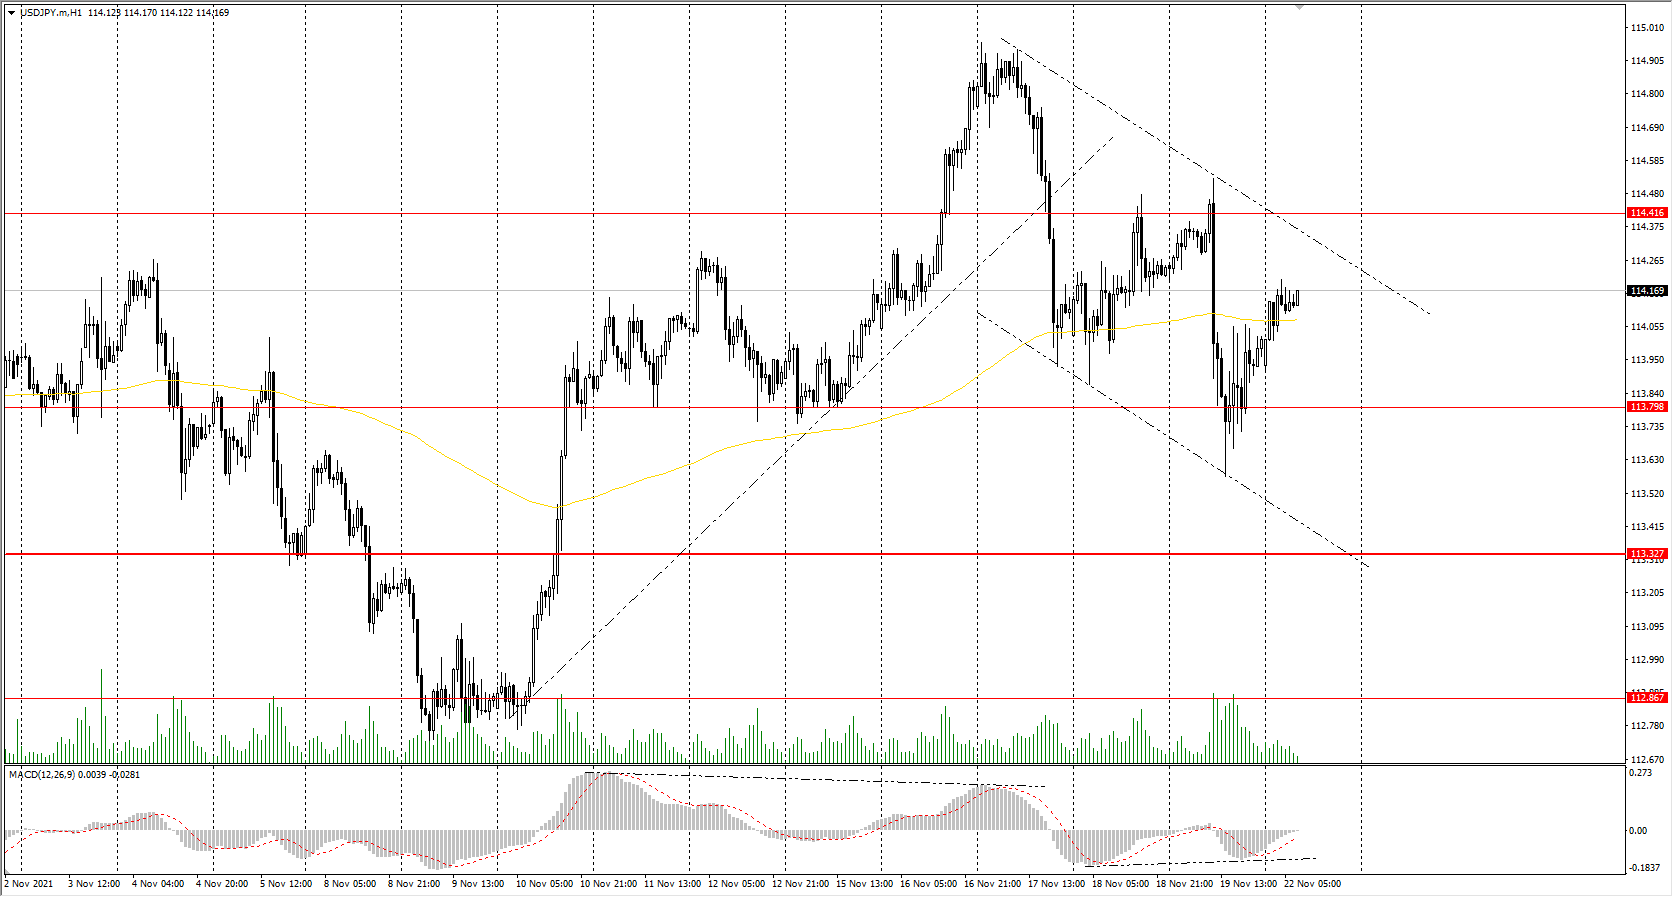
Support levels: 113.79, 113.32, 112.87, 112.30
Resistance levels: 114.42, 115.15, 115.50
The global trend on the USD/JPY currency pair is bullish. But the price has corrected to the moving average line. The MACD indicator has become inactive. Under such market conditions, it’s better to look for buy positions from the buyers’ initiative zone near the moving average. Sell positions should be considered from the resistance levels of higher time frames, given there is sellers’ initiative, but only with short targets.
Alternative scenario: if the price falls below 113.32, the uptrend will likely be broken.
The USD/CAD currency pair
Technical indicators of the currency pair:
Prev Open: 1.2598
Prev Close: 1.2636
% chg. over the last day: +0.30%
The Canadian dollar is a commodity currency, so the USD/CAD currency pair highly depends on the dynamics of the dollar index and oil prices. On Friday, the dollar index increased slightly while oil prices decreased. As a result, the USD/CAD currency pair increased due to the strengthening of the US dollar. Fundamentally, both the dollar index and oil quotes have an upward trend now, so in the medium term USD/CAD will be trading flat.
Trading recommendations
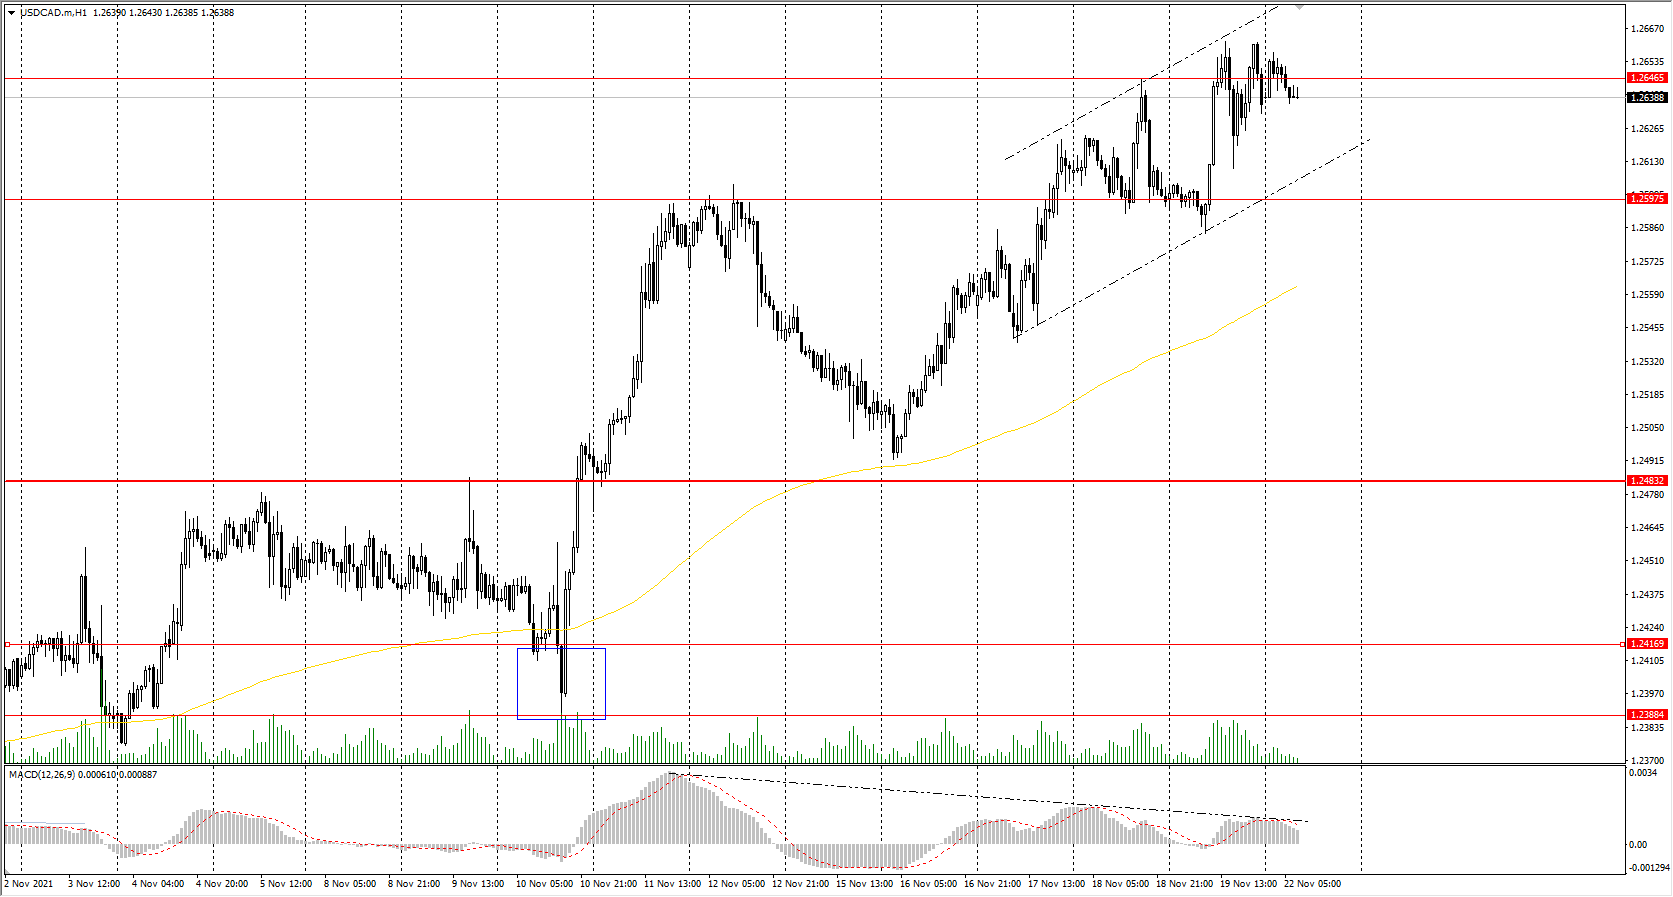
Support levels: 1.2598, 1.2483, 1.2416, 1.2388
Resistance levels: 1.2646, 1.2729
From a technical point of view, the trend of the USD/CAD currency is bullish. The MACD indicator is in the positive zone, but there are signs of divergence on several time frames, which indicates the weakness of the buyers. Under such market conditions, it is better to look for buy trades from the support levels near the moving average. Sell deals should be considered from the resistance levels of the higher time frames.
Alternative scenario: if the price breaks down through the 1.2483 support level and fixes below, the downtrend will likely resume.


