
The EUR/USD currency pair
Technical indicators of the currency pair:
Prev Open: 1.1234
Prev Close: 1.1248
% chg. over the last day: +0.12%
Europe continues to face power shortages in the region. Electricity prices in some countries are approaching historic highs. The business activity index in Europe increased unexpectedly, which was a surprise to analysts who had expected a slowdown in activity, especially in the manufacturing sector. However, there are no fundamental reasons for the euro to rise now as the ECB continues to print money actively.
Trading recommendations
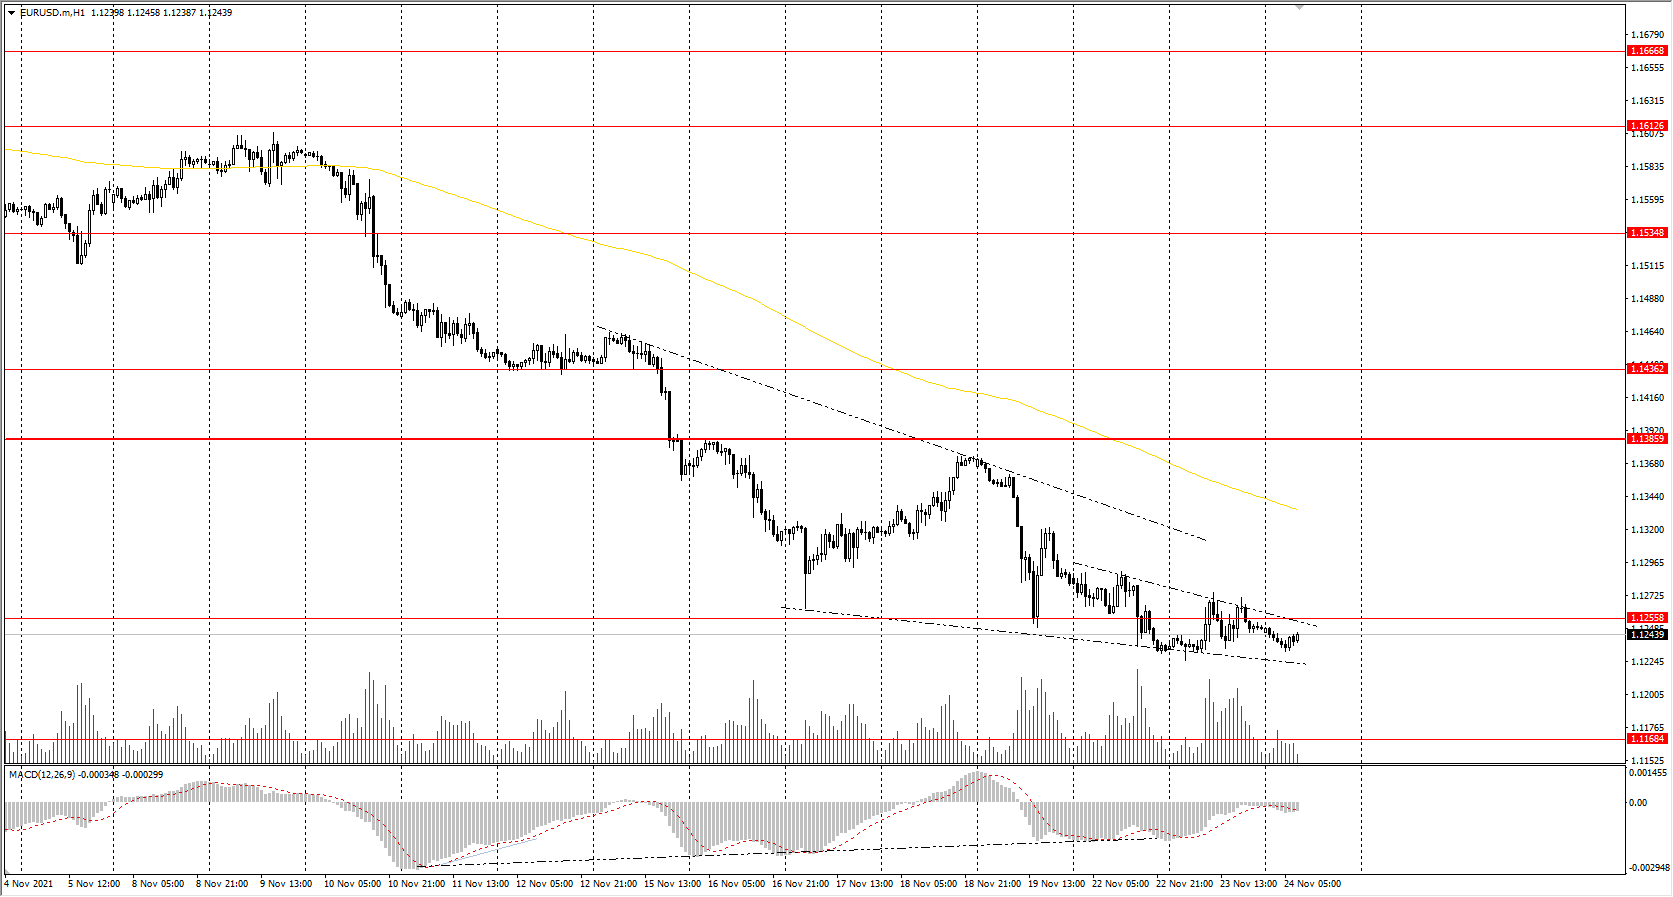
Support levels: 1.1256, 1.1168
Resistance levels: 1.1386, 1.1436, 1.1535, 1.1613, 1.1667, 1.1717
From a technical point of view, the EUR/USD pair is bearish on the hour time frame. The Euro continues to show weakness, but the price is narrowing in a triangle, suggesting an impulsive movement. The MACD indicator has become inactive, but there are signs of divergence at several time frames, so traders should expect a technical rebound. Under such market conditions, traders should consider sell positions from the resistance levels near the moving average since the price has deviated strongly from the averages. Buy trades should be considered only from the support levels of the higher time frame, given the buyers’ initiative, but only with short targets.
Alternative scenario: if the price breaks out through the 1.1386 resistance level and fixes above, the mid-term uptrend will likely resume.
News feed for 2021.11.24:
- German Ifo Business Climate (m/m) at 11:00 (GMT+2);
- US Prelim GDP (q/q) at 15:30 (GMT+2);
- US Core Durable Goods Orders (m/m) at 15:30 (GMT+2);
- US Initial Jobless Claims (w/w) at 15:30 (GMT+2);
- US PCE price index (m/m) at 17:00 (GMT+2);
- US New Home Sales (m/m) at 17:00 (GMT+2);
- US Michigan Consumer Sentiment (m/m) at 17:00 (GMT+2);
- US FOMC Meeting Minutes at 21:00 (GMT+2).
The GBP/USD currency pair
Technical indicators of the currency pair:
Prev Open: 1.3392
Prev Close: 1.3378
% chg. over the last day: -0.10%
In the UK, there is an increase in business activity. Data for October showed an increase in the manufacturing sector, while in the services sector, the data was negative. With expectations of an interest rate hike from the Bank of England, the British pound might be strengthened soon.
Trading recommendations
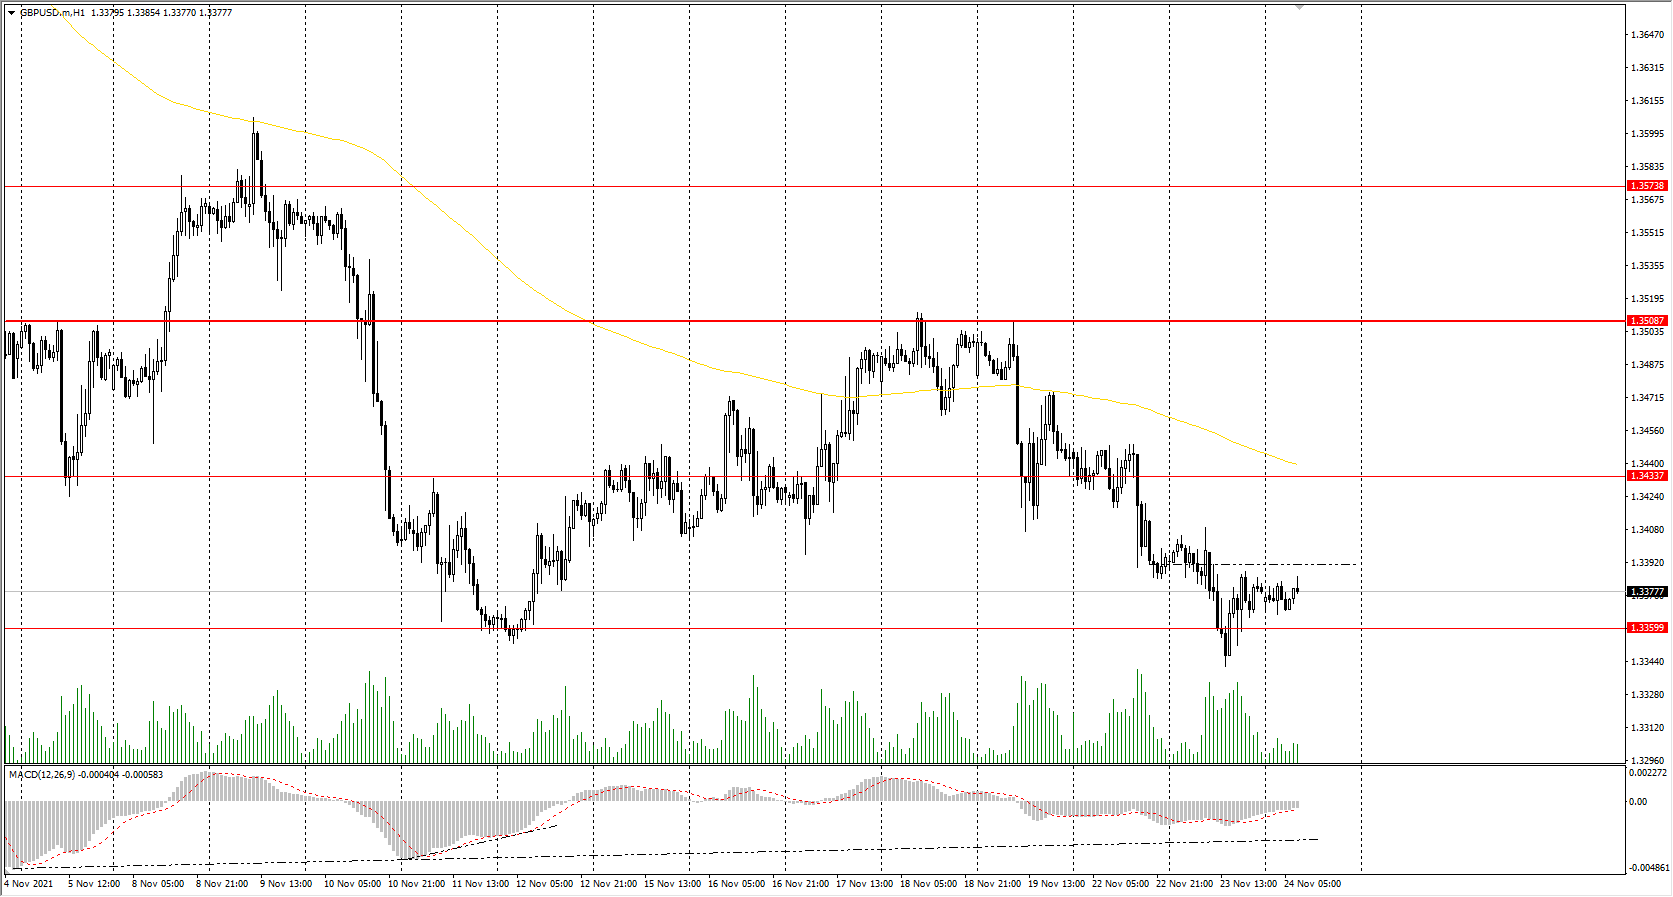
Support levels: 1.3360
Resistance levels: 1.3434, 1.3507, 1.3575, 1.3685, 1.3748
On the hourly time frame, the trend on GBP/USD is bearish. The MACD indicator has become inactive. The currency pair has formed a clear flat corridor with the range of 1.3360-1.3508. Under such market conditions, traders should consider sell positions from the upper border of the range. Buy trades should be considered only from the lower border of the range, given the buyers’ initiative.
Alternative scenario: if the price breaks out through the 1.3507 resistance level and consolidates above, the bullish scenario will likely resume.
The USD/JPY currency pair
Technical indicators of the currency pair:
Prev Open: 114.87
Prev Close: 115.12
% chg. over the last day: +0.22%
Japan’s business activity index showed an improvement for October. The lifting of the restrictions has already been reflected in the economic data more than a month ago. The economic situation in Japan will improve slowly. However, the JPY will be losing its position against the USD because the Bank of Japan does not plan to cut its stimulus program at the moment.
Trading recommendations
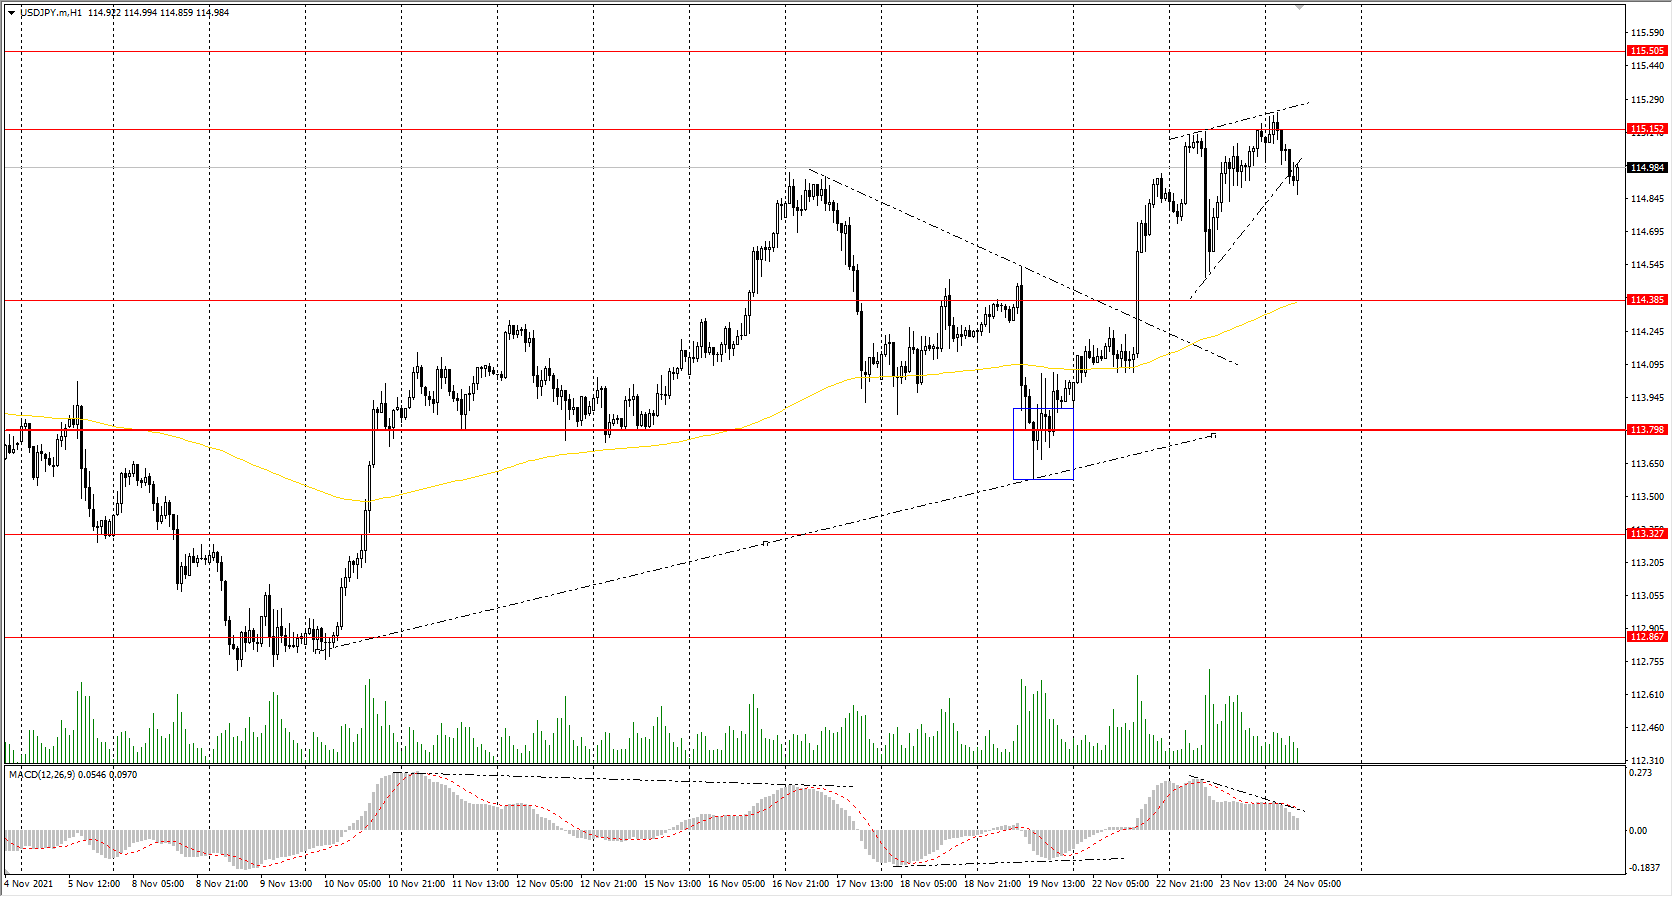
Support levels: 114.38, 113.79, 113.32, 112.87, 112.30
Resistance levels: 115.15, 115.50
The global trend on the USD/JPY currency pair is bullish. The MACD indicator is positive, but there are the first signs of divergence. Under such market conditions, it’s better to look for buy positions from the buyers’ initiative zone near the moving average. Sell positions should be considered from the resistance levels of higher time frames, given there is sellers’ initiative, but only with short targets.
Alternative scenario: if the price falls below 113.79, the uptrend will likely be broken.
News feed for 2021.11.24:
- Japan Manufacturing PMI (m/m) at 02:30 (GMT+2);
The USD/CAD currency pair
Technical indicators of the currency pair:
Prev Open: 1.2698
Prev Close: 1.2668
% chg. over the last day: -0.23%
The Canadian dollar is a commodity currency, so the USD/CAD currency pair highly depends on the dynamics of the dollar index and oil prices. Yesterday, the dollar index was trading in a narrow range, while the oil prices increased by more than 3%, despite the possible oil reserves released by the USA, Japan, China, and India. As a result, the USD/CAD currency pair increased due to the strengthening of the Canadian dollar.
Trading recommendations
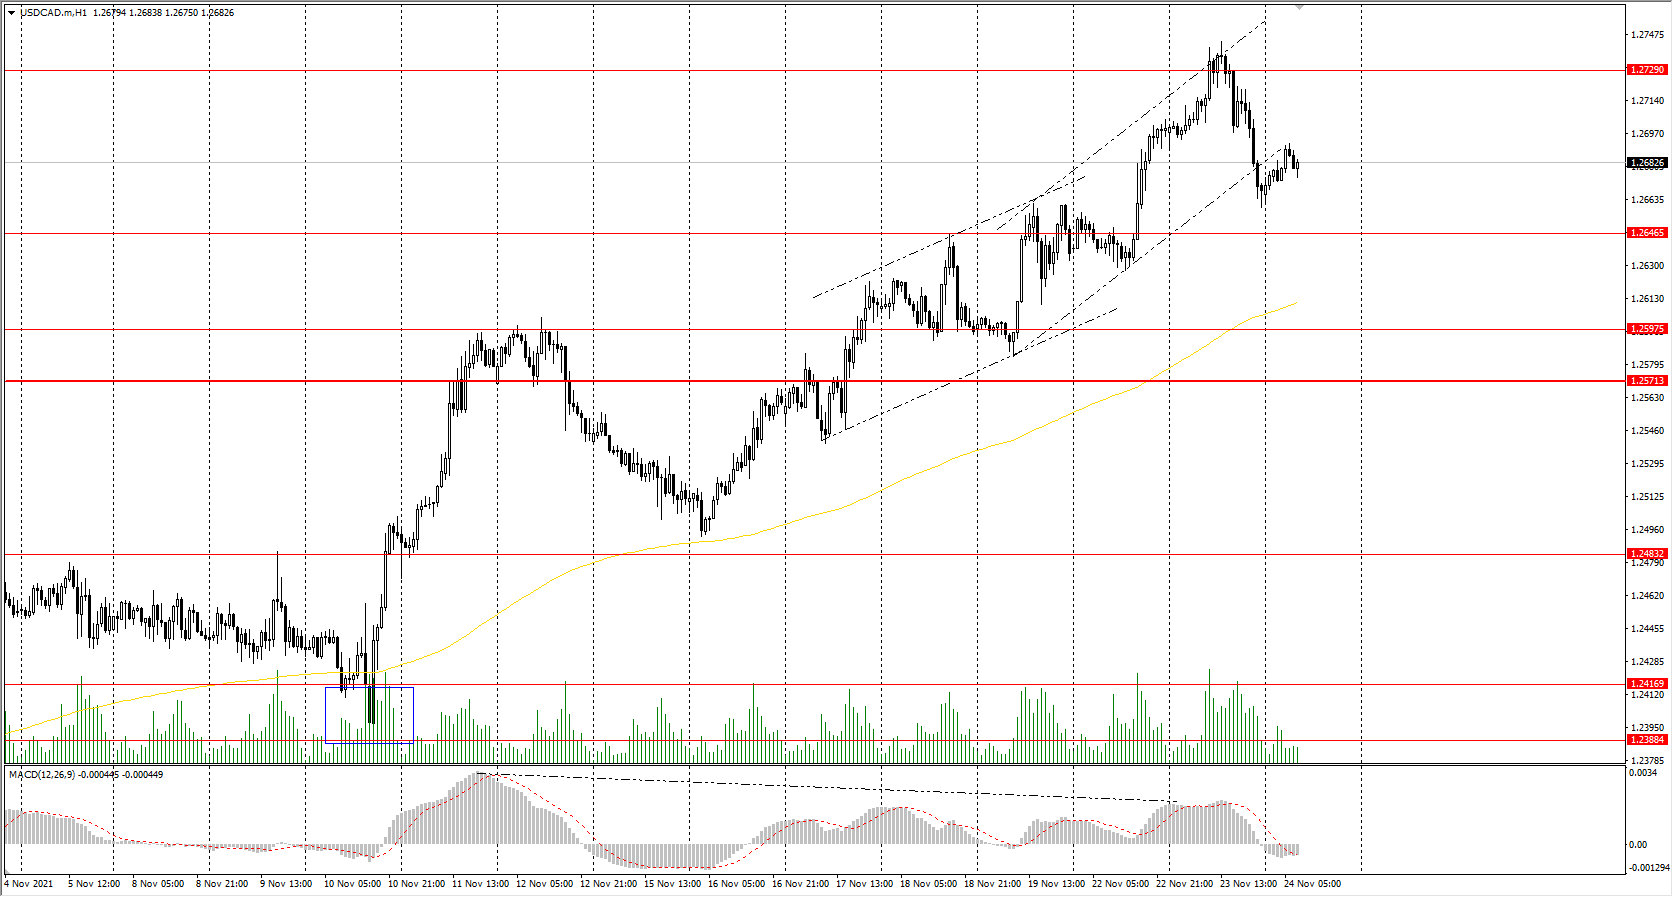
Support levels: 1.2646, 1.2598, 1.2571, 1.2483, 1.2416, 1.2388
Resistance levels: 1.2729
From a technical point of view, the trend of the USD/CAD currency is bullish. The MACD indicator has become inactive. There are signs of divergence on several time frames while indicating a weakness of buyers. Under such market conditions, it is better to look for buy trades from the support levels near the moving average since the price has strongly deviated from the average values. Sell deals should be considered from the resistance levels of the higher time frames.
Alternative scenario: if the price breaks down through the 1.2571 support level and fixes below, the downtrend will likely resume.
News feed for 2021.11.24:
- US Crude Oil Reserves (w/w) at 17:30 (GMT+2).


