
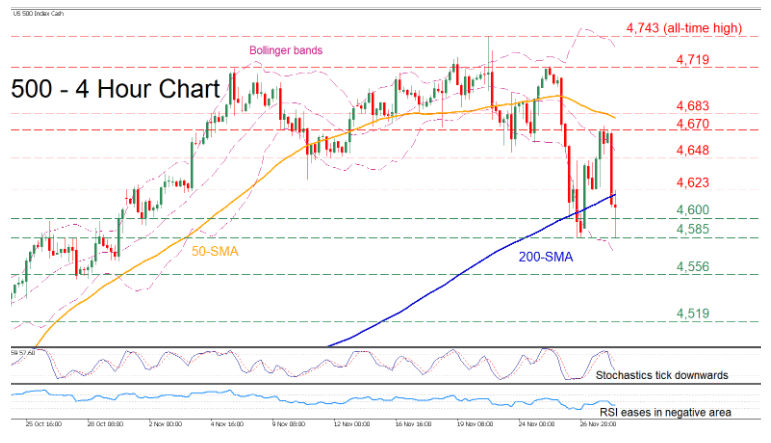
The US 500 stock index (cash) keeps trending upwards in the long term picture, creating a profound structure of higher highs and higher lows. However, in the four-hour chart, the index has been giving up ground since its rally halted at the new record high of 4,743.
This recent pullback is likely to continue as the short-term oscillators indicate that the positive momentum is fading. The stochastic oscillator is negatively charged, while the RSI is flatlining well below the 50-neutral mark.
Should the selling pressure intensify, the 4,600 psychological mark might act as immediate support. A drop below this level would open the way for the 4,585 region. If sellers overcome this obstacle, 4,556 could prove a strong support point for the price before the spotlight turns to the 4,519 hurdle.
On the flip side, if buyers manage to retake control and the price ascends, initial resistance could be encountered at the 4,623 region. Overcoming this level, the next barricade for the index might be met at 4,648 or even higher at the 4,670 level. Clearing these barricades, the price may then challenge the 4,683 barrier.
Overall, the US 500 index appears to have run out of steam after posting a new all-time high. For the negative short-term picture to alter, the price needs to sustainably move above 4,719.


