
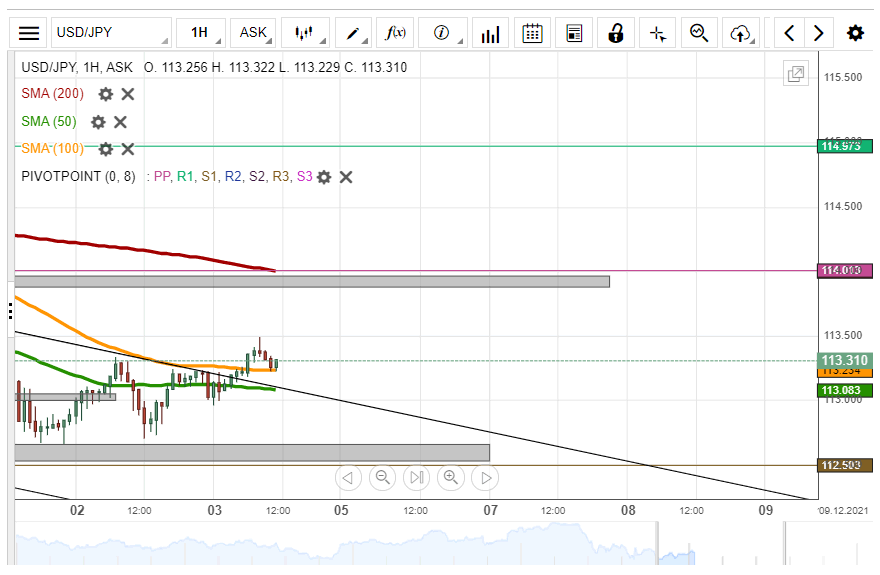
On Friday morning, the upper trend line of the channel down pattern and the 100-hour simple moving average failed to provide resistance to the USD/JPY currency exchange rate. Namely, the pair surged above them and touched the 113.50 mark, before retracing to look for support in the 100-hour SMA.
A resumption of the surge of the USD/JPY pair might first test the resistance of the 113.50 level. Above the 113.50 mark, this week’s high levels at 113.88/113.97, the 200-hour SMA near 114.00, the 114.00 mark by itself an the weekly simple pivot point at 114.01 make up a major cluster of resistance.
However, a potential decline of the rate might look for support in the 100-hour simple moving average at 113.25 and the 50-hour simple moving average at 113.08. Below the SMAs, note the 112.53/112.66 support zone, which represents this week’s low levels.


