
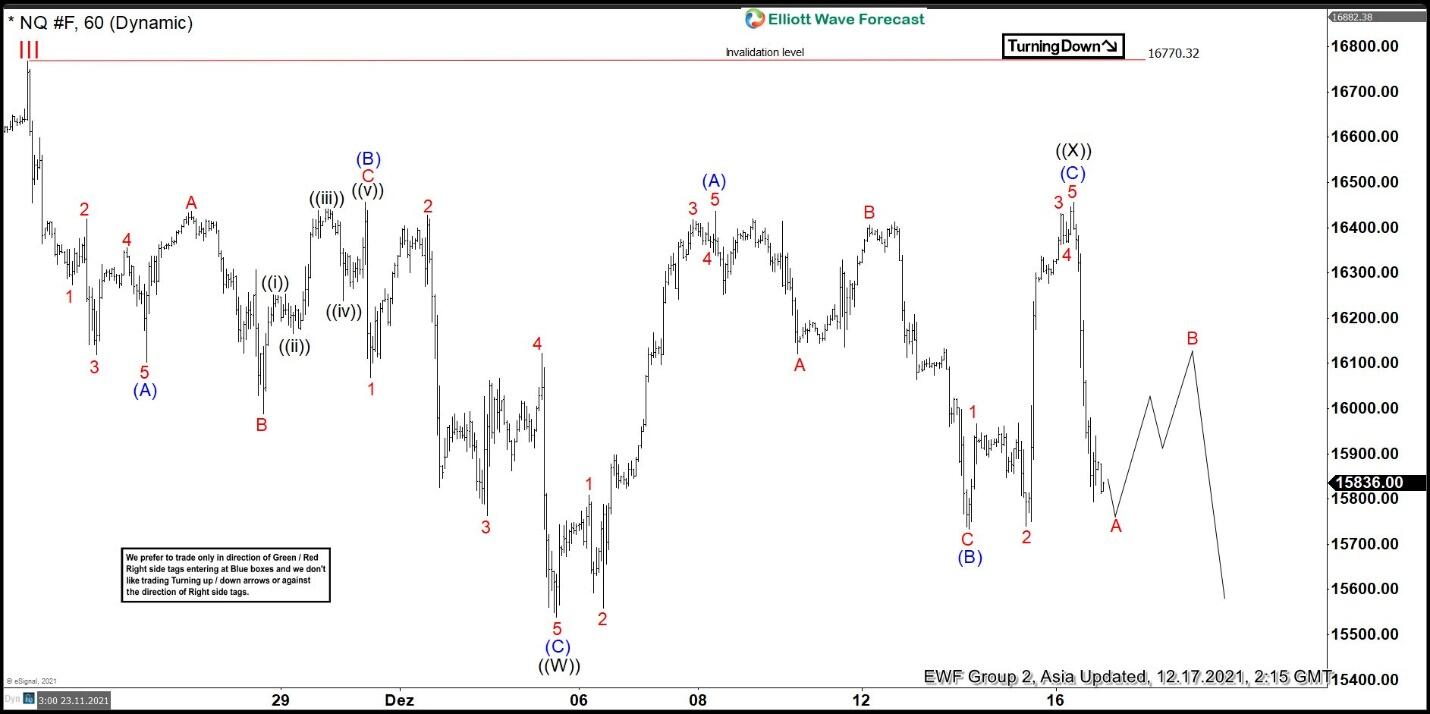
Short-term Elliott wave view in Nasdaq (NQ) suggests rally to 16770.32 ended wave III. Pullback in wave IV is currently in progress with subdivision as a double three Elliott Wave structure. Down from November 22, 2021 peak, wave (A) ended at 16102, and rally in wave (B) ended at 16456.25. Index then extends lower in wave (C) towards 15538. This completed wave ((W)) in larger degree. Index then rallied in wave ((X)) with subdivision as a zigzag. Up from wave ((W)), wave (A) ended at 16436.75 and pullback in wave (B) ended at 15734. Index then extends higher in wave (C) towards 16457 which completed wave ((X)).
The Index has turned lower again in wave ((Y)). It however still needs to break below wave ((W)) at 15538 to validate the view. Near term, it’s expected to rally in wave B to correct cycle from December 16, 2021 peak before the next leg lower. As far as pivot at 16770.32 high stays intact, expect wave B rally to fail in the sequence of 3, 7, or 11 swing for more downside. Potential target to the downside is the 100% – 161.8% Fibonacci extension of wave ((W)) towards 14467 – 15227 area.
Nasdaq 60 Minutes Elliott Wave Chart


