
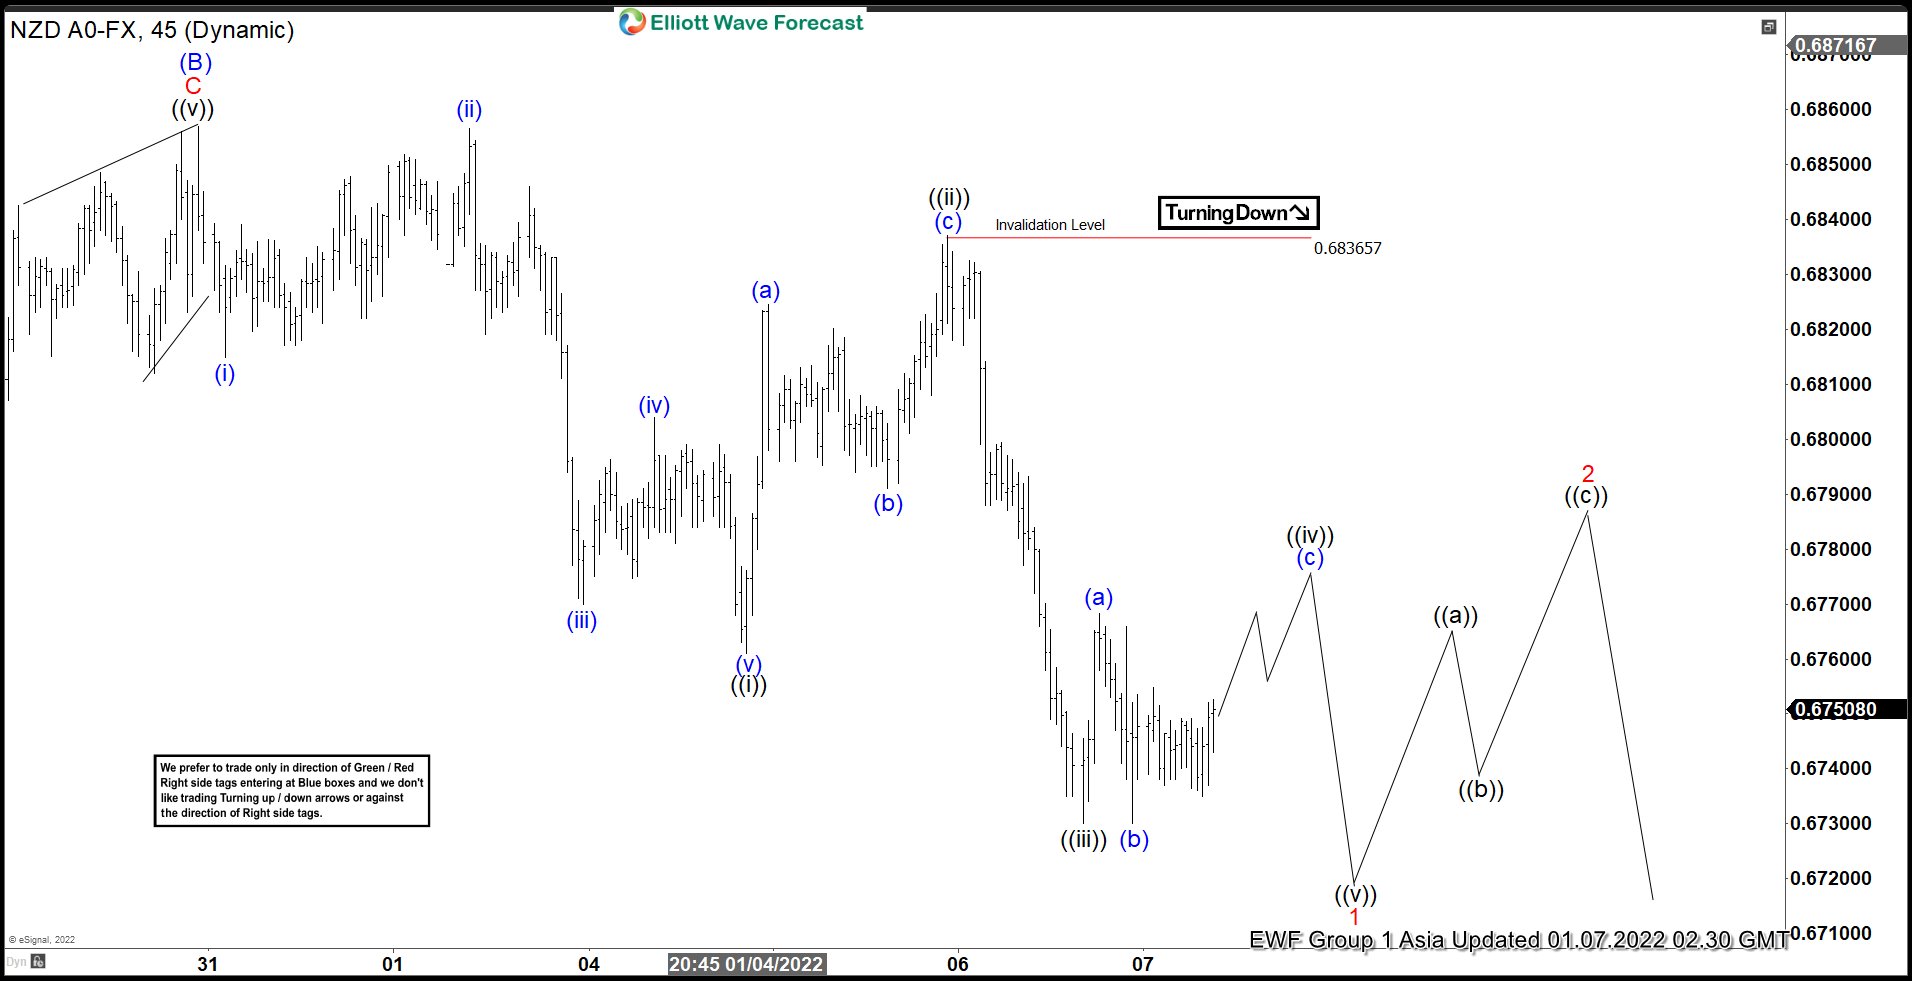
Short Term Elliott Wave View in NZDUSD suggests the decline from October 21, 2021 peak is unfolding as a zigzag Elliott Wave structure. Down from October 21 high, wave (A) ended at 0.67018 and wave (B) rally is proposed complete at 0.6857 as the 45 minutes chart below shows. Pair should still break below wave (A) at 0.67018 to rule out a double correction in wave (B). Wave (C) lower is currently in progress with internal subdivision as a 5 waves impulse.
Down from wave (B), wave ((i)) ended at 0.6761 and rally in wave ((ii)) ended at 0.6836. Pair then resumed lower in wave ((iii)) towards 0.6730. Wave ((iv)) is in progress and as far as rally fails below 0.6836, expect pair to turn lower in wave ((v)) to complete wave 1. Afterwards, pair should rally in wave 2 to correct cycle from December 30, 2021 peak before the decline resumes in wave 3. Potential target lower is 100% – 161.8% Fibonacci extension from October 21, 2021 high which comes at 0.615 – 0.655. Near term, while pivot at 0.6836 high, and more importantly at 0.6857 high stays intact, expect rally to fail in the sequence of 3, 7, 11 swing for more downside.
NZDUSD 45 Minutes Elliott Wave Chart


