
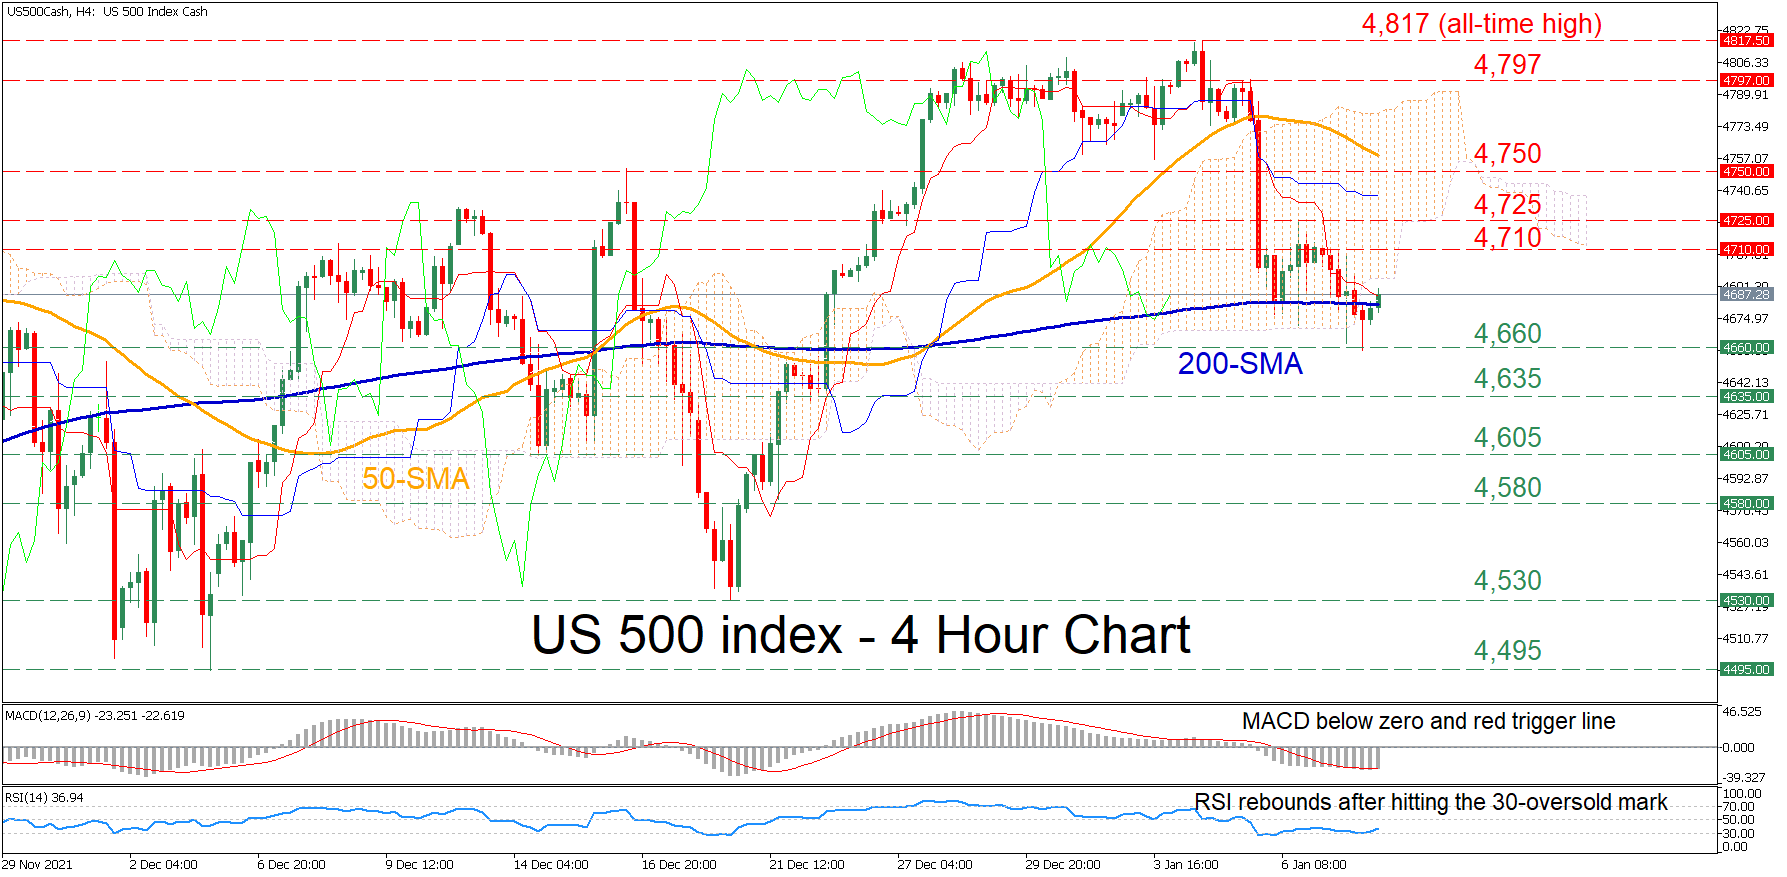
The US 500 stock index (cash) has been plummeting in the four-hour chart since its upside trajectory peaked at the all-time high of 4,817. Moreover, the price crossed beneath both its 50-period simple moving average (SMA) and the Ichimoku cloud, further reinforcing the index’s imminent bearish bias.
The recent pullback is likely to resume as the short-term oscillators indicate that selling forces have taken control. The MACD is found below its red signal line in the negative region, while the RSI is ticking slightly upwards well below its 50-neutral mark.
If the price continues to descend, immediate support might be encountered at the recent low of 4,660. Breaching this barrier, the bears could aim at the 4,635 region before the price dips towards the 4,605 level. Further downside pressure could send the price to test the 4,580 level.
On the flipside, should the dive halt and the price reverses upwards, buyers may meet initial resistance at the recent high of 4,710. Should the bulls conquer this barricade, the spotlight would turn to 4,725 or higher to the 4,750 region. Piercing through these hurdles, the price might charge higher to challenge the 4,797 obstacle.
Overall, the outlook for the US 500 stock index has turned negative in the short term, after the long-term upside move ceased at the record high of 4,817. For that bearish tone to reverse, the price needs to profoundly cross above the 4,797 region.


