
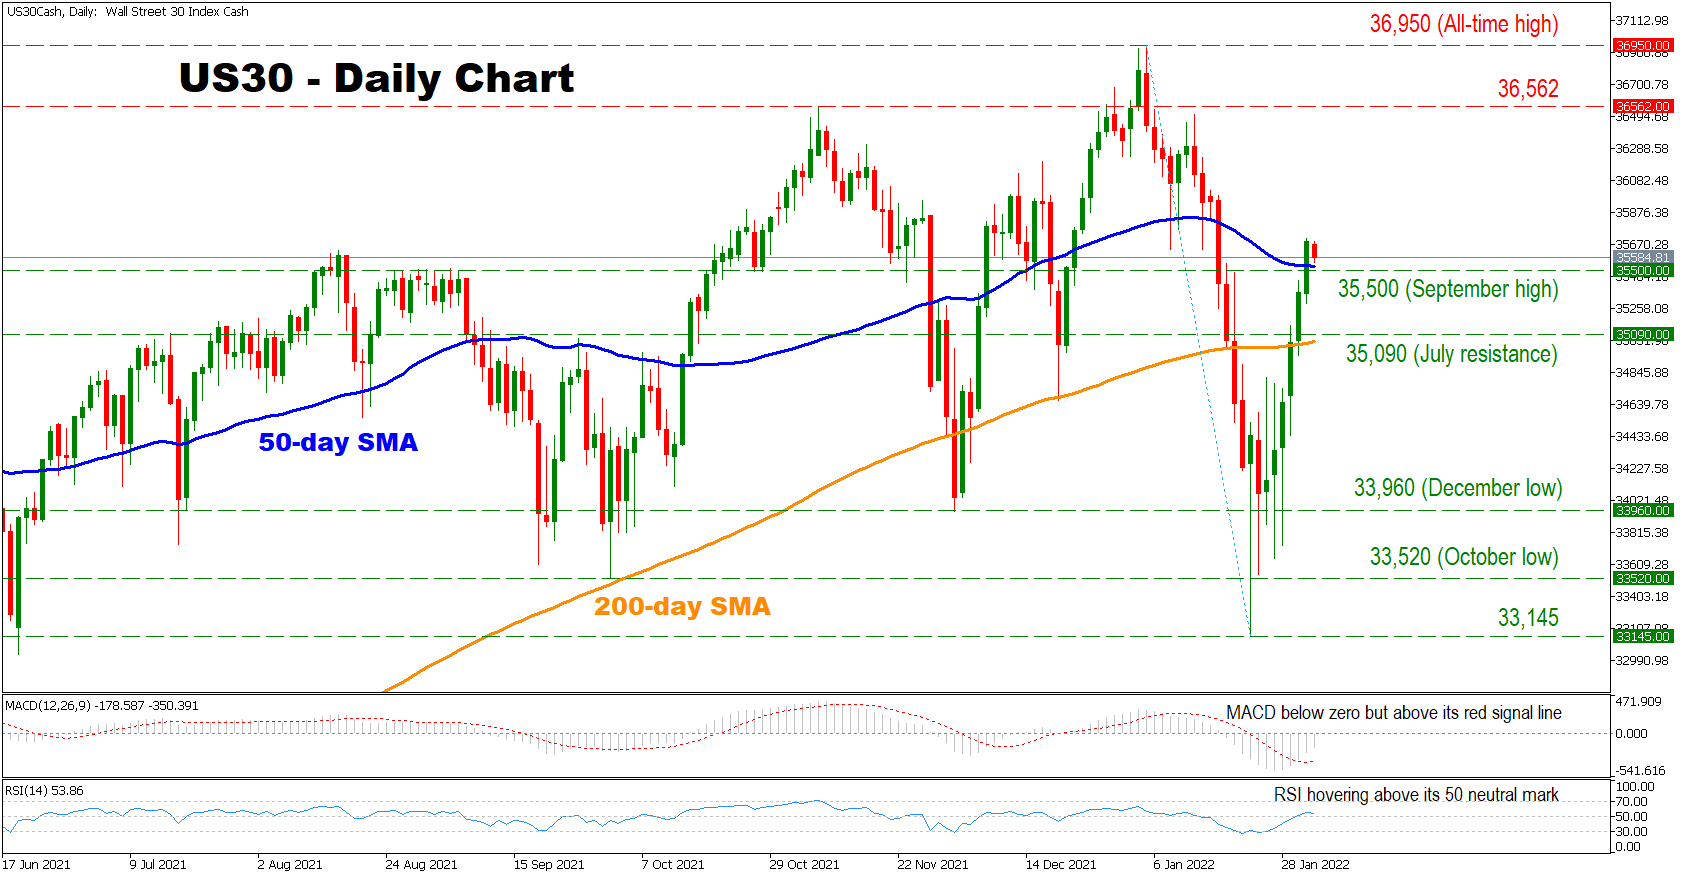
The US 30 cash index came back swinging after its January retreat, as the downtrend move appeared to be overextended. Currently, the index is trading above its 50- and 200-day simple moving averages (SMA), supporting an overall cautiously bullish outlook.
Short-term momentum indicators are also reflecting a positive bias as the RSI is hovering above its 50 neutral mark. Moreover, despite being below zero, the MACD is found above its red signal line, which indicates that the recent negative forces are waning.
Should the bulls maintain control, initial resistance might be found at the 36,562 hurdle before buyers shift their attention towards the all-time high of 36,950. Surpassing the latter, the price would enter uncharted waters, possibly targeting the 161.8% Fibonacci extension of the January 5 to January 24 downleg at 39,300.
On the flip side, the region which includes the 50-day SMA and the 35,500 obstacle might be the first line of defence, before sellers eye the area which includes the July resistance at 35,090 and the 200-day SMA currently at 35,040. Crossing below the 200-day SMA could increase selling pressures, opening the door towards the consecutive hurdles of 33,960 and 33,520.
In brief, the overall outlook for the index is cautiously bullish. For that to change, the sellers would need to break below the 200-day SMA.


