
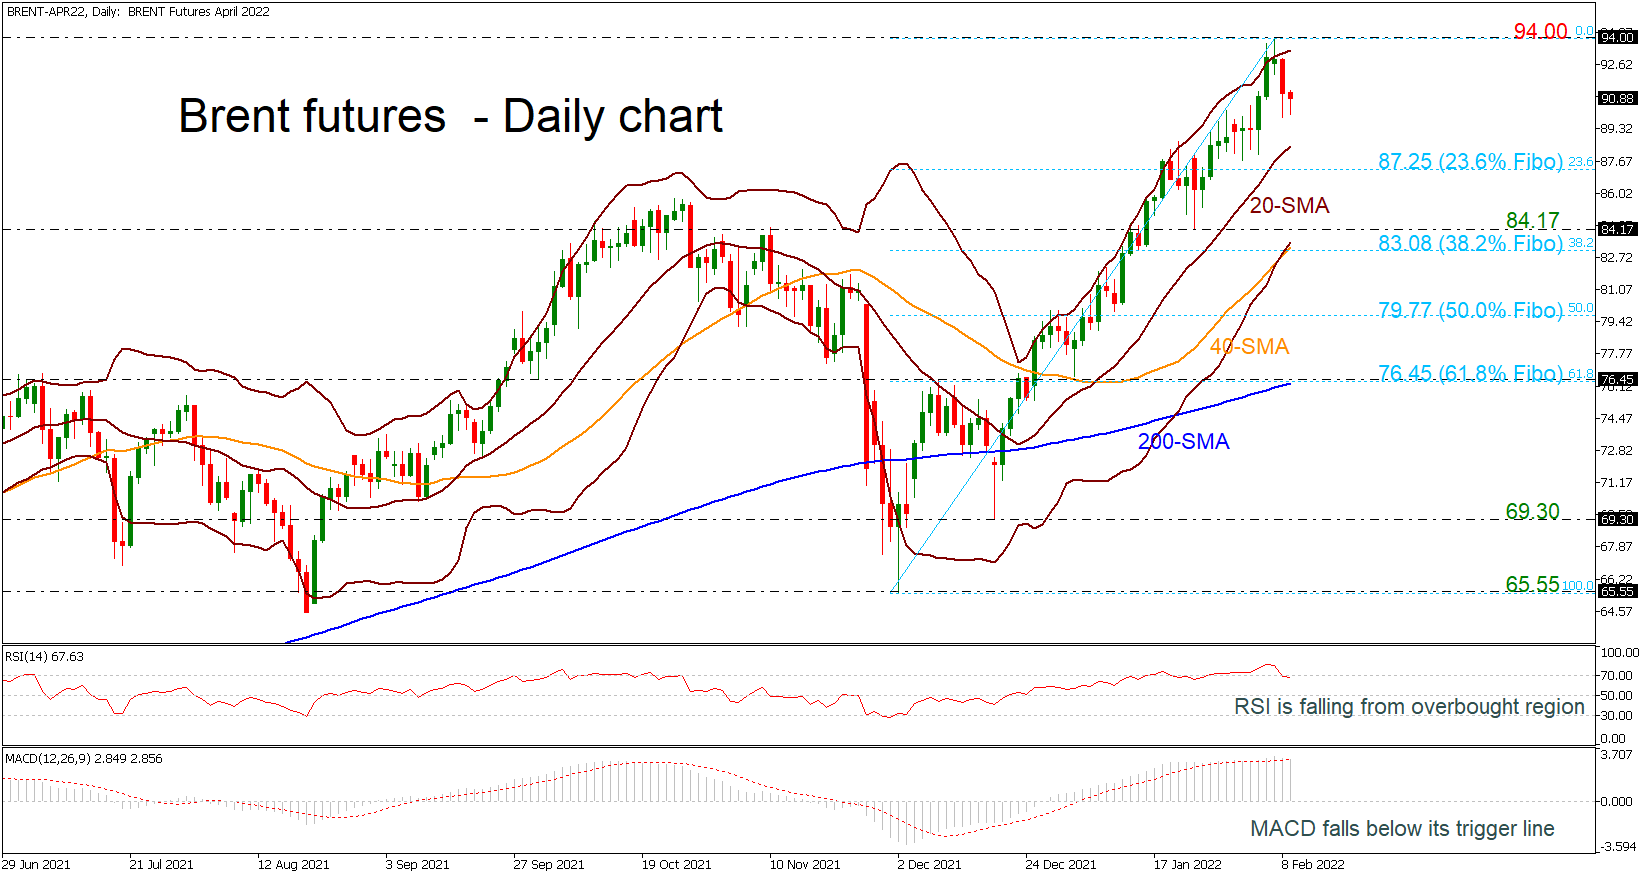
Brent crude oil futures are easing after they reached the upper Bolling band and a new high at 94.00 on Monday. The RSI indicator is falling from the overbought region, while the MACD is dropping below its trigger line in the positive area, both suggesting a negative correction in the short-term timeframe.
If the price retreats further, the mid-level of the Bollinger band, which is also the 20-day simple moving average (SMA) at 88.37 could come immediately in focus. A drop lower could meet the 23.6% Fibonacci retracement level of the up leg from 65.55 to 94.00 at 87.25. Moving lower, the 84.17 support but more importantly the 38.2% Fibonacci, which overlaps with the 40-day SMA and the lower Bollinger band around 83.08 may act as a turning point. Steeper decreases could open the way for a bearish correction until the 50.0% Fibonacci of 79.77 and the 200-day SMA at 76.45, which lies the 61.8% Fibonacci as well.
In the positive scenario, a successful climb above the upper Bollinger band may have a rest at the 94.00 peak before rallying to fresh highs such as the next psychological levels of 95.00 and 96.00.
All in all, Brent futures have been in an upside tendency since December 2021 and only a daily close below the 200-day SMA may change this outlook to negative.


