
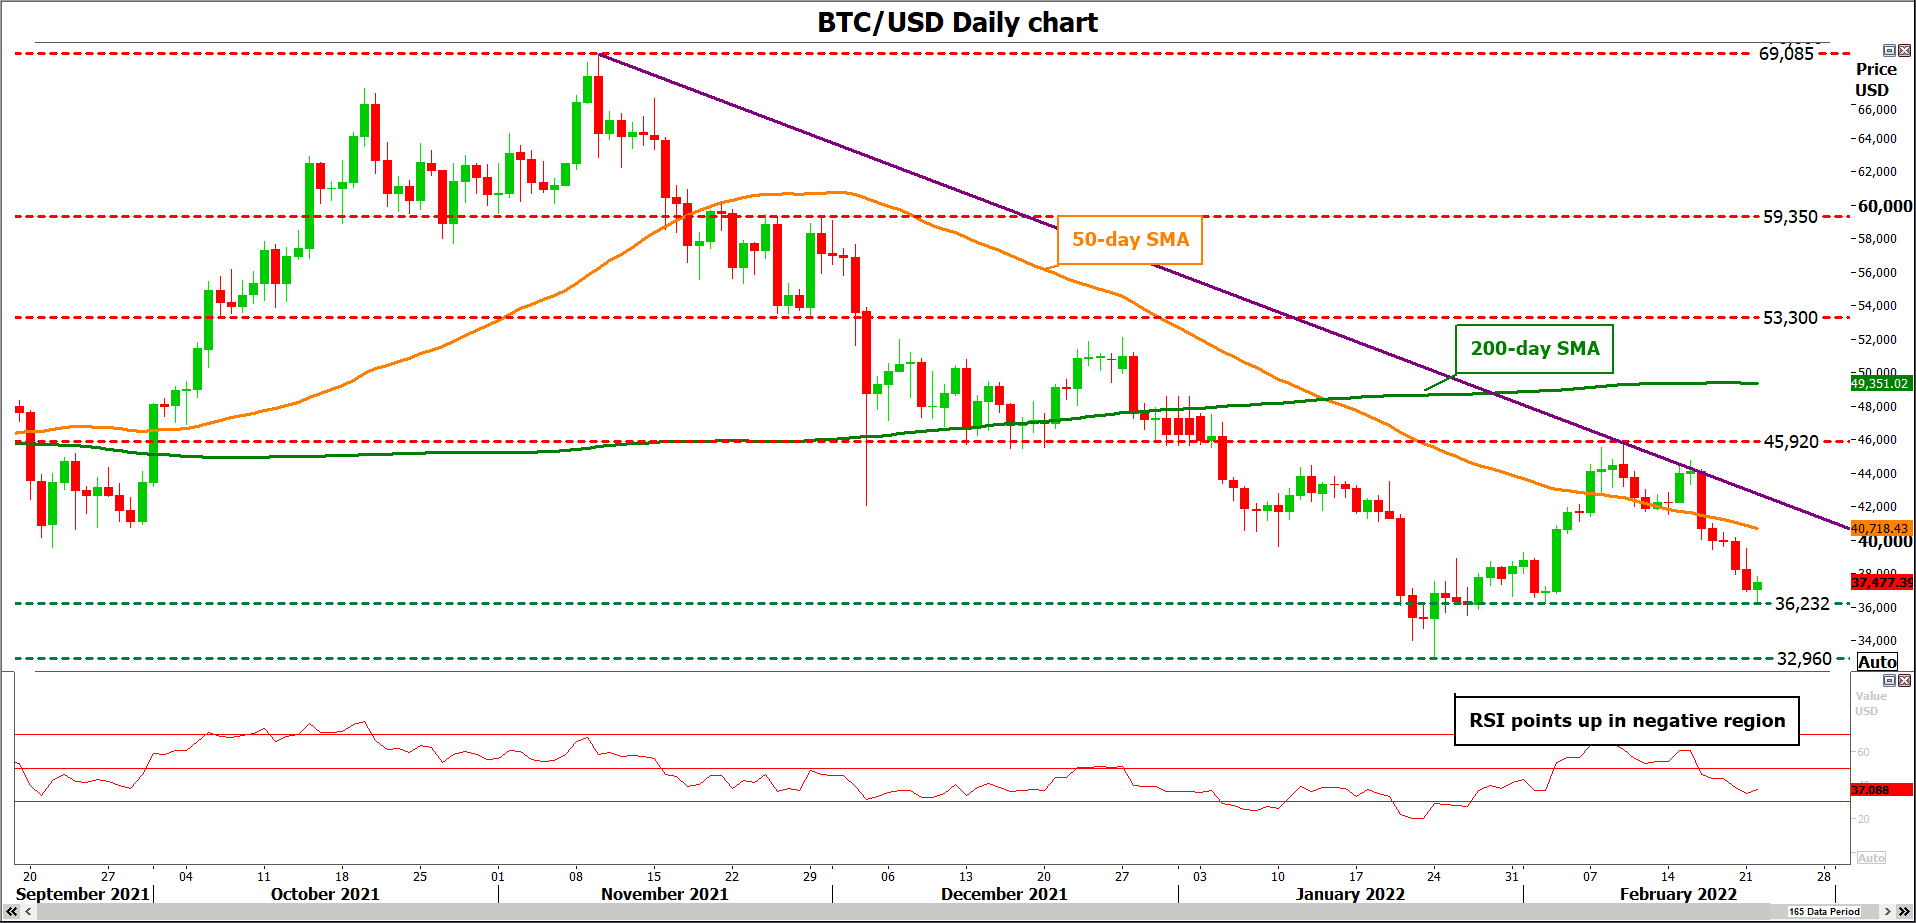
BTCUSD found support at the 36,232 level after the negative movement that started after the pullback off the descending trend line. The RSI indicator is heading upwards in the negative region, suggesting a potential upside recovery.
Should the pair stretch north, the 50-day simple moving average (SMA) could provide immediate resistance before the prices touches the ascending trend line around 42,000. A significant step higher, breaking the diagonal line could bring the bullish sentiment back into play, sending the price probably towards 45,920. If the buying interest extends, attention could then turn to the 200-day SMA at 49,351.
On the flip side, immediate support could come from the 36,232 level which may halt bearish movements. Steeper decreases could also touch the 32,960 support level, taken from the latest low.
In the medium-term picture, BTCUSD has been trading bearish in the past three months after the drop below the 69,085 high. Still, if the price manages to cross above the 200-day SMA at 49,351, the bearish outlook could switch into a bullish one.


