
The S&P 500 falls back as yield curve inversion raises concerns of an economic contraction.
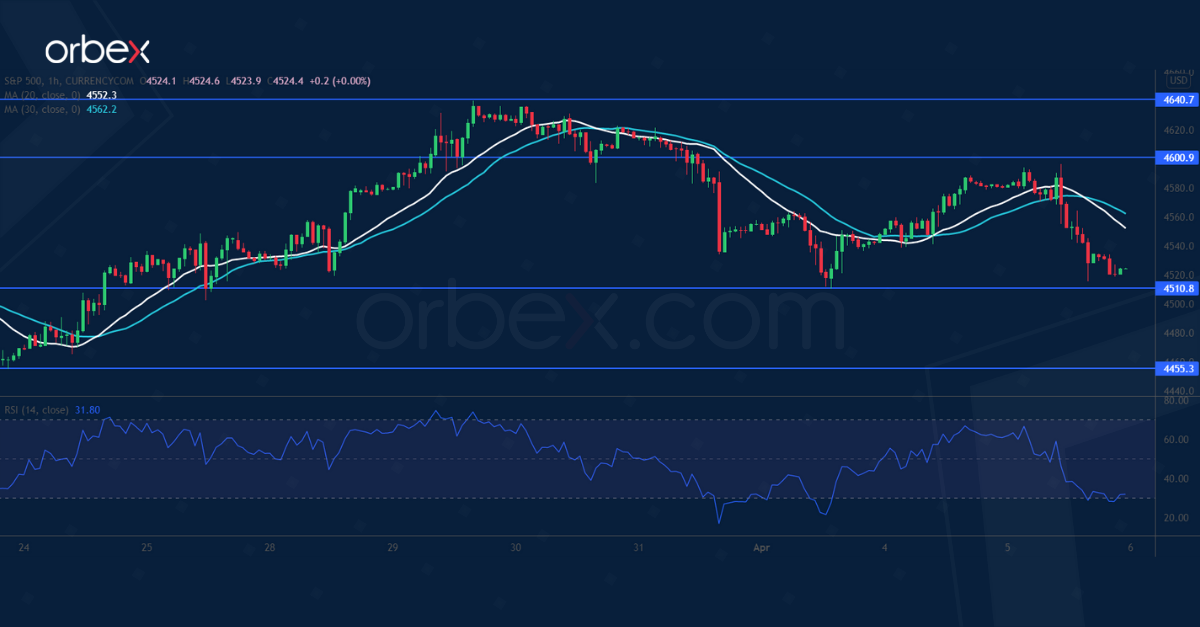
On the daily chart, a break above the February high at 4590 and a bullish MA cross suggest a steady market mood. A drop below 4580 prompted leverage buyers to bail out but found support at 4510.
4455 on the 20-day moving average would be the second line of defense in case of a deeper correction. Buyers may see short-term retracements as opportunities to stake in. A bounce above 4600 could be a continuation signal.


