
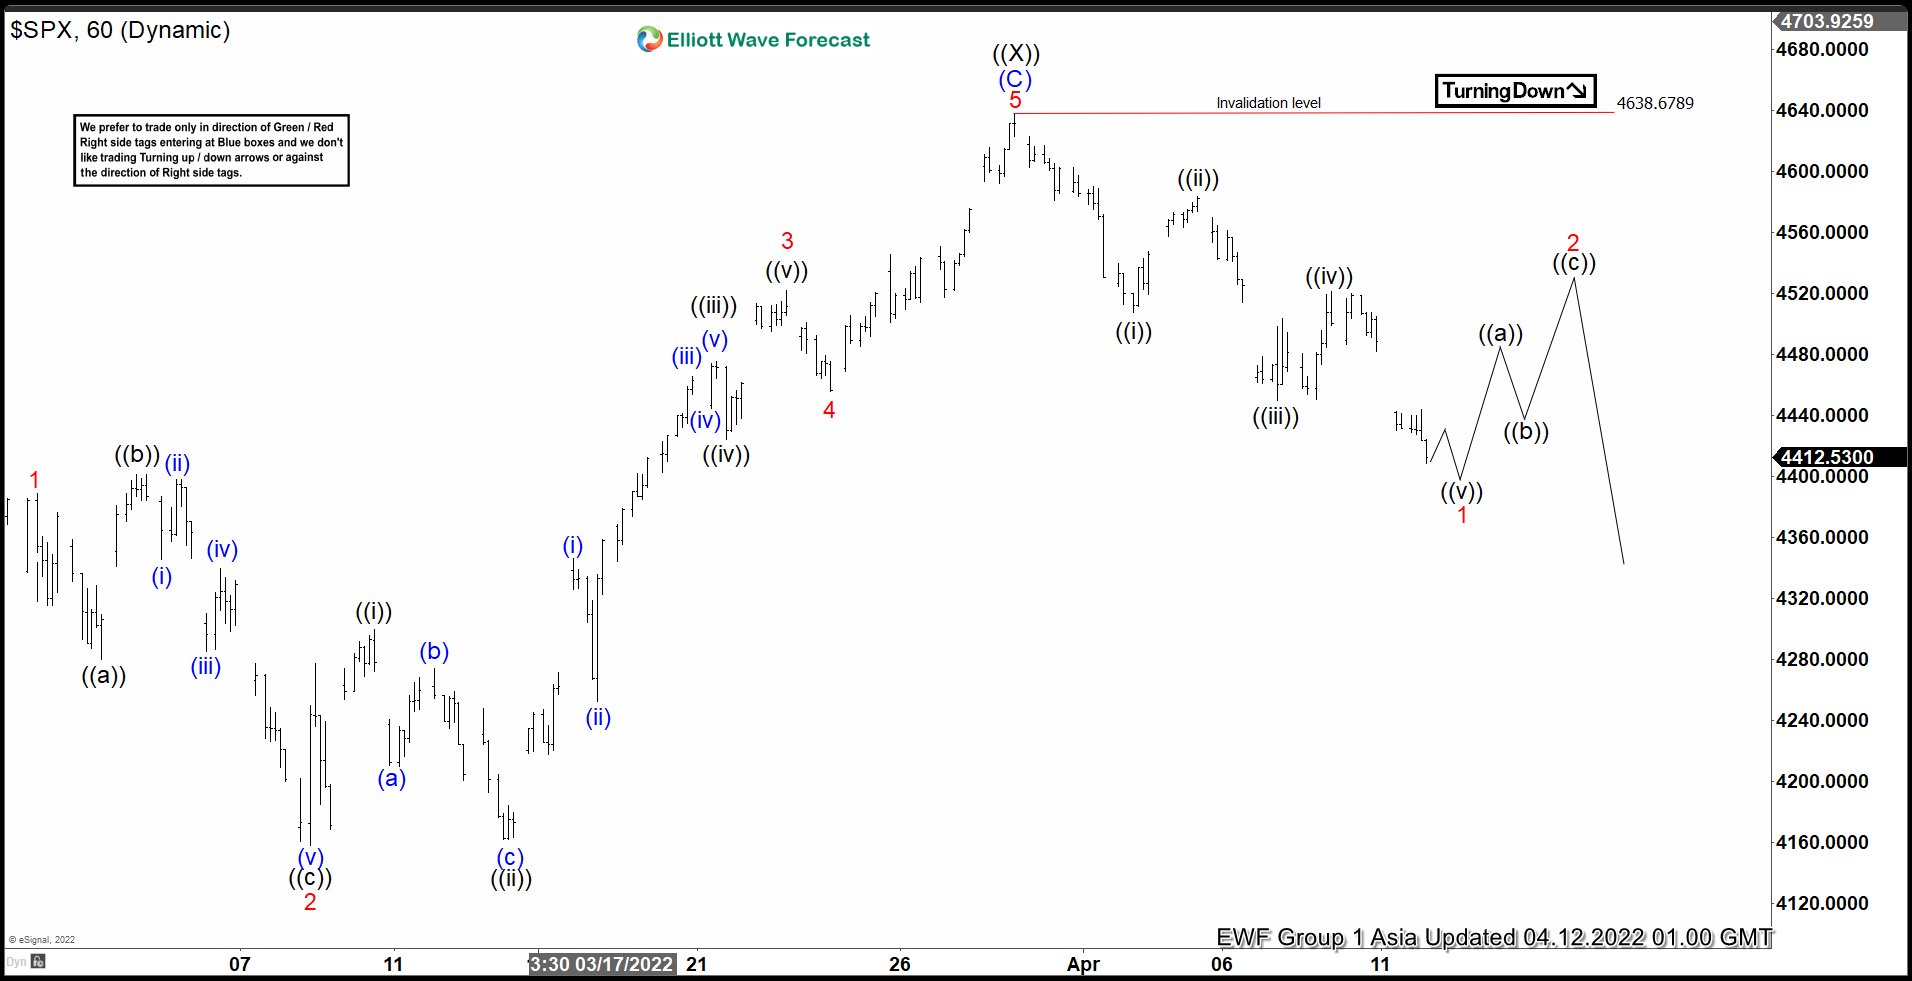
Short term Elliott Wave view in S&P 500 (SPX) suggests that the decline from January 4, 2022 is unfolding as a double three Elliott Wave structure. Down from January 4 peak, wave ((W)) ended at 4222.62 and wave ((X)) ended at 4638.67. Internal of wave ((X)) unfolded as an expanded Flat structure. Up from wave ((W)), wave (A) ended at 4595.3, wave (B) ended at 4153, and wave (C) higher ended at 4637.3. This completed wave ((X)) in higher degree.
The Index has since turned lower in wave ((Y)). Down from wave ((X)), the decline shows a 5 swing in the form of a diagonal. Wave ((i)) ended at 4507.57 and rally in wave ((ii)) ended at 4583.5. Index then resumes lower in wave ((iii)) to 4450.04, and rally in wave ((iv)) ended at 4521.16. Expect wave ((v)) to end soon which should complete wave 1. Afterwards, Index should rally in wave 2 to correct cycle from March 30 peak before it resumes lower again. Near term, as far as pivot at 4638.67 high stays intact, expect rally to fail in the sequence of 3, 7, or 11 swing for further downside.
$SPX 60 Minutes Elliott Wave Chart


