
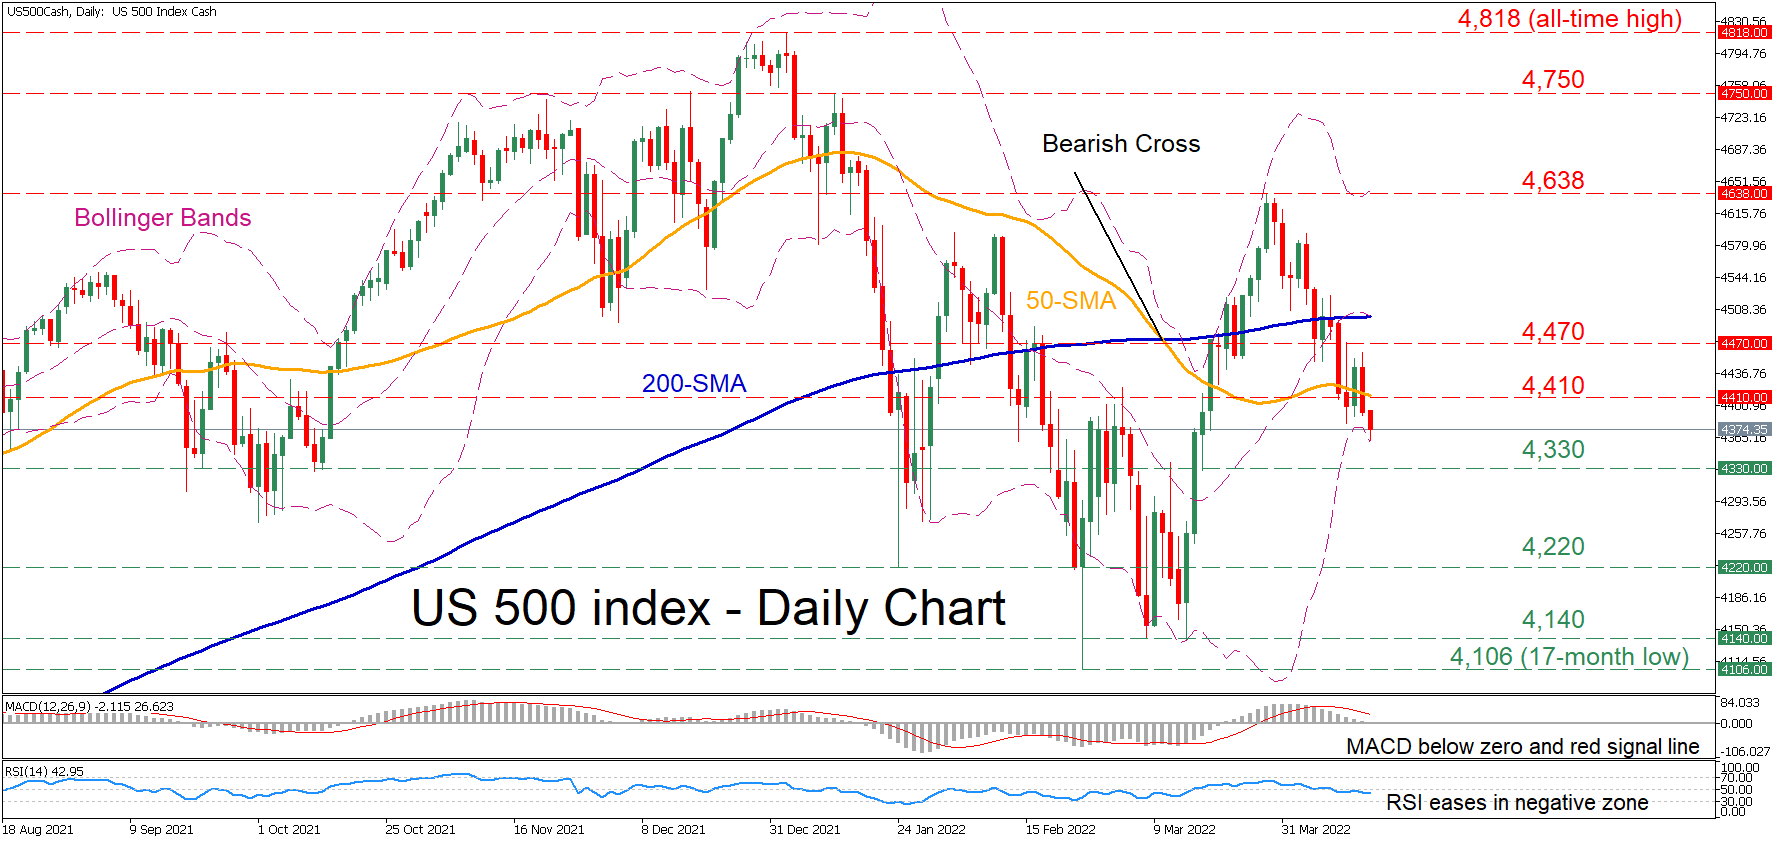
The US 500 stock index (cash) has been inching lower after peaking at 4,638 in mid-March, generating a clear structure of lower highs and lower lows. Although the price decline has currently paused at the lower Bollinger band, the technical picture seems to be deteriorating for the index.
The momentum indicators suggest that selling interest has intensified. The MACD histogram has dipped below both zero and its red signal line, while the RSI is hovering beneath its 50-neutral threshold.
In the negative scenario, bearish actions could send the price to test the 4,330 barrier. Further downside moves could then cease at the January low of 4,220 before the price descends towards the 4,140 region, which rejected price declines twice in March. A violation of the latter could pave the way for the 17-month low of 4,106.
Alternatively, should buyers re-emerge and regain the upper hand, the 50-day simple moving average (SMA), currently at 4,410, could be the initial resistance point for the index. If the price crosses above this region, the bulls may target the 4,470 obstacle before the March high of 4,638 appears on the radar. Conquering this barricade, the spotlight could turn to the 4,750 hurdle.
Overall, the resumption of the US 500 index’s recent decline appears to be the most likely scenario as near-term risks are tilted to the downside. For the bearish tone to alter, the price needs to jump above the 4,638 ceiling.


