
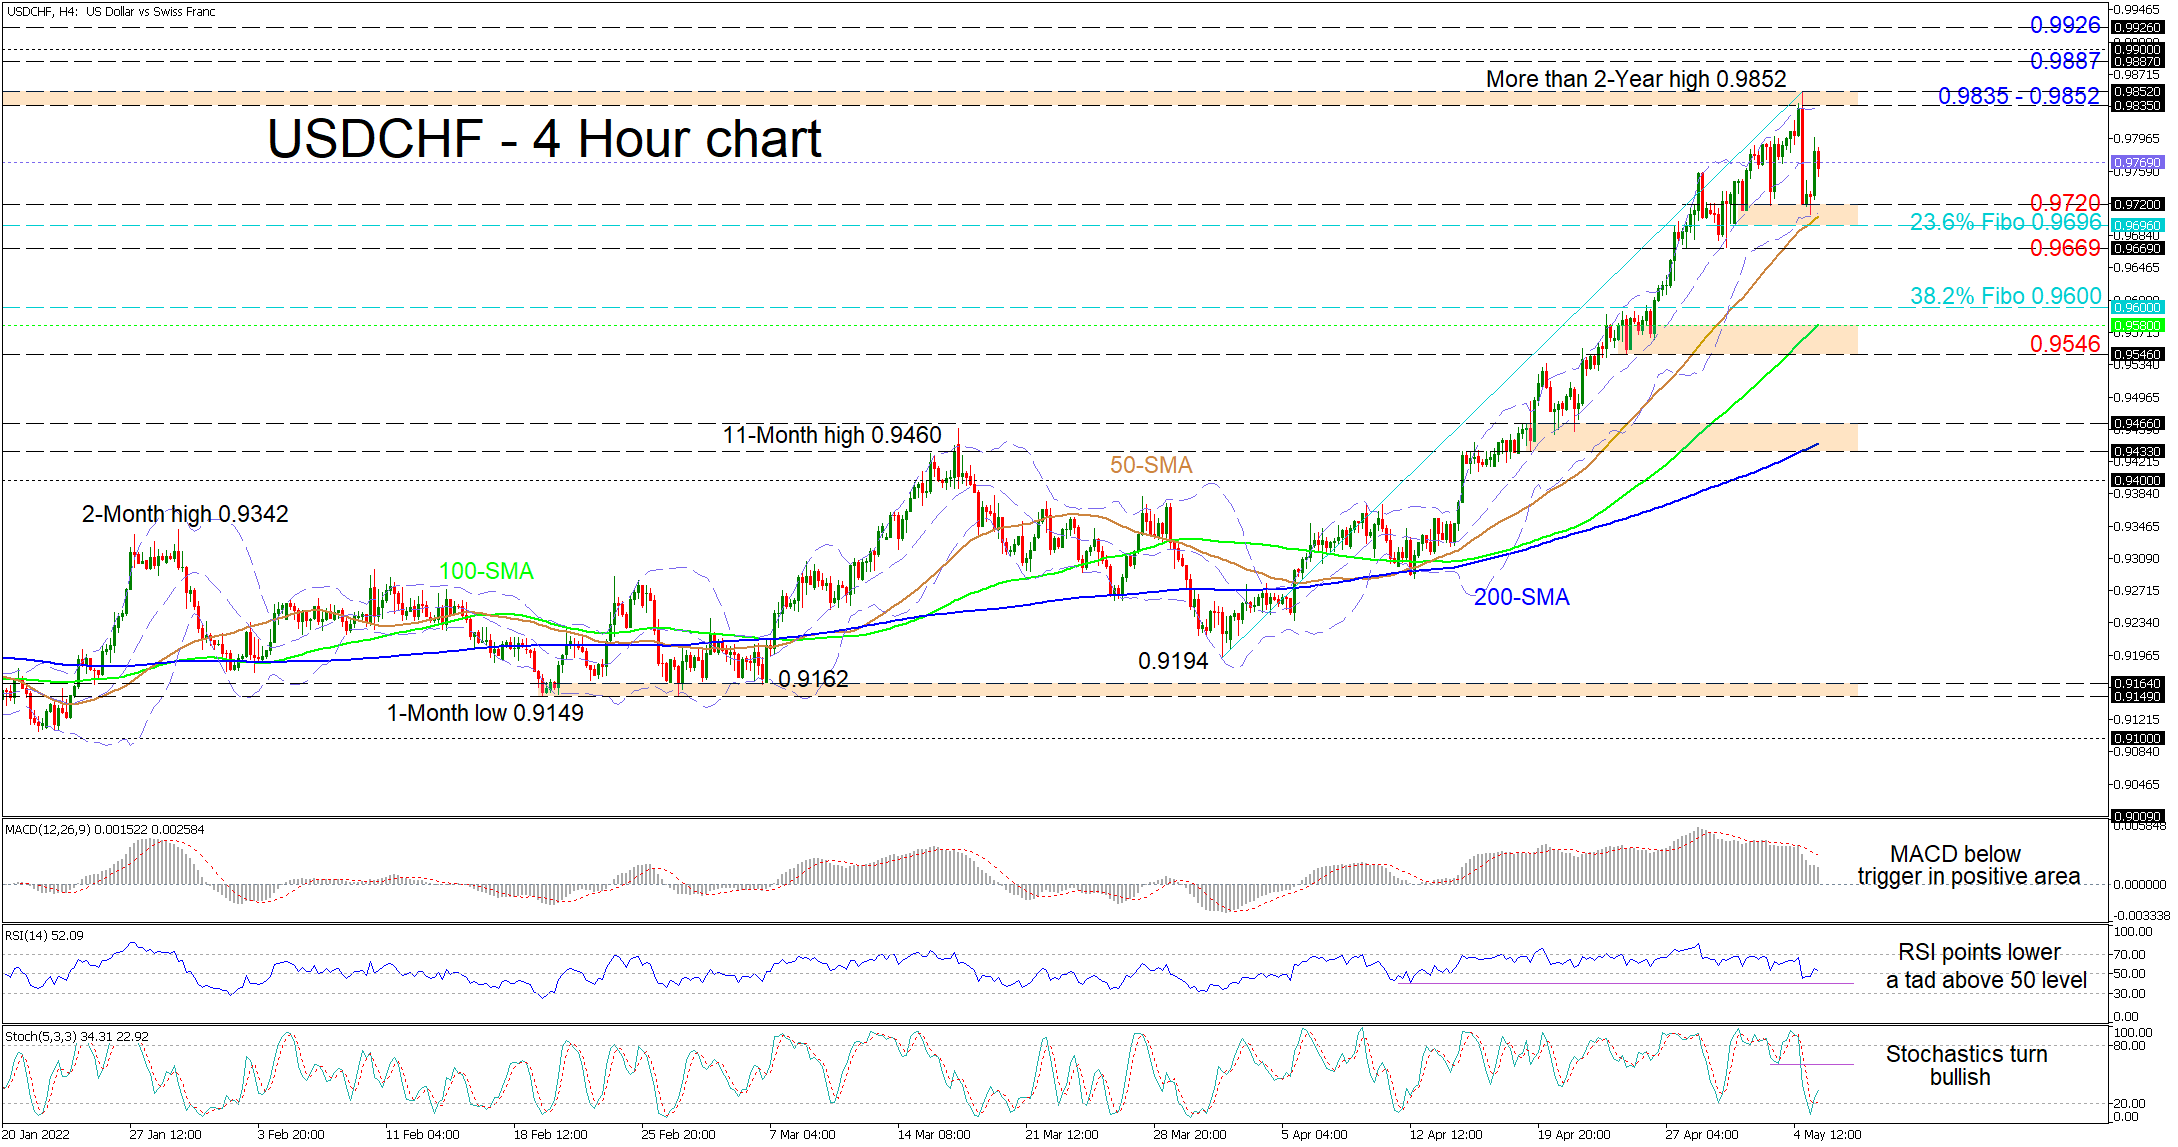
USDCHF has bounced toward the mid-Bollinger band after testing the 50-period simple moving average (SMA) currently around the 0.9700 mark. The soaring simple moving averages (SMAs) are defending the more than one-month uptrend in the pair despite the retreat in the pair that came short of the 0.9696 level, which is the 23.6% Fibonacci retracement of the up leg from 0.9194 until 0.9852.
The short-term oscillators are indicating conflicting messages in directional momentum. The MACD, in the positive region, has detached from its red trigger line and is heading towards the zero line, while the stochastic oscillator continues to promote upside impetus in the pair. Meanwhile, the RSI, in bullish territory, is directing lower and is about to flirt with the 50 threshold.
As things stand, for negative pressures to gain an advantage, an increase in selling interest from the mid-Bollinger band would need to overwhelm the 0.9696-0.9720 critical support section, the former being the 23.6% Fibo and the latter the recent troughs. A successful break of this fortified base, which includes the lower Bollinger band and the ascending 50-period SMA, could intensify downside forces with the bears promptly testing the April 29 low of 0.9669. Should a deeper correction unfold, the sellers may then aim for the 38.2% Fibo of 0.9600 before challenging the support region linking the 100-period SMA at 0.9580 and the 0.9546 trough.
However, if the pair lifts back above the mid-Bollinger band at 0.9769, the bulls could then eye the upper Bollinger band and adjoining 0.9835-0.9852 resistance band that stretches back more than two-years. Rekindling the uptrend, buyers may attempt to reel in the 0.9887 and the 0.9900 resistance barriers, recorded back in March 2020. If buying interest persists, the pair could then seek out the December 2019 high of 0.9926.
Summarizing, USDCHF is sustaining a bullish bias above the 0.9696-0.9720 support foundation, the SMAs and the 0.9669 trough. That said, a retracement past the 0.9600 handle could weigh on the 0.9546-0.9580 support, throwing some doubt about the resilience of the uptrend.


