
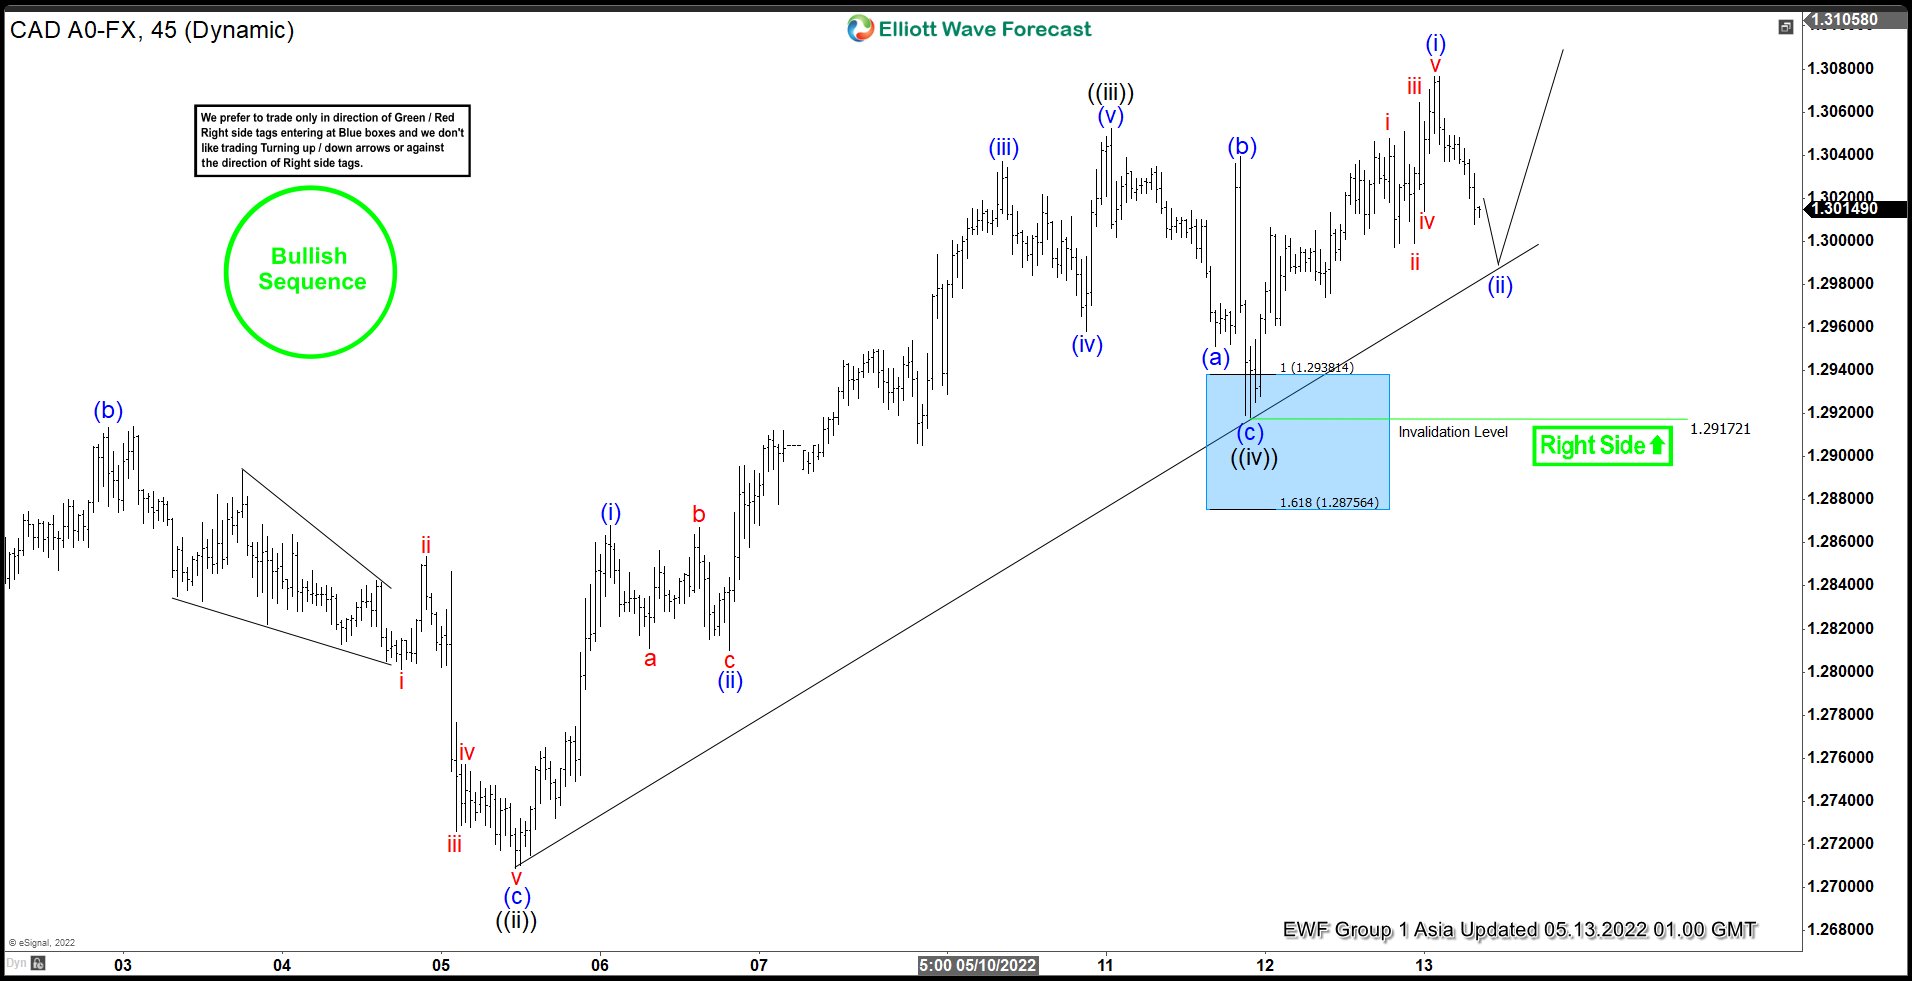
Short Term View in USDCAD suggests cycle from 04.21.2022 low is in progress as a 5 waves impulse Elliott Wave structure. Up from April 21 low, wave ((i)) ended at 1.288 and dips in wave ((ii)) ended at 1.2709. Pair then resumes higher in wave ((iii)) with internal subdivision as an impulse in lesser degree. Up from wave ((ii)), wave (i) ended at 1.2868 and pullback in wave (ii) ended at 1.281. Pair then resumes higher in wave (iii) towards 1.3037, wave (iv) ended at 1.295. Final wave (v) ended at 1.305 which completed wave ((iii)).
Pullback in wave ((iv)) unfolded as a zigzag structure. Down from wave ((iii)), wave (a) ended at 1.295, wave (b) ended at 1.304, and wave (c) ended at 1.2917 which completed wave ((iv)). Wave (c) ended at the 100% – 161.8% Fibonacci extension of wave (a). This area is denoted as a blue box on the chart. Pair has resumed higher in wave ((v)). Up from wave ((iv)), wave (i) ended at 1.3076. Near term, as far as pivot at 1.2917 low stays intact, expect pullback to find support in 3, 7, or 11 swing for further upside.
USDCAD 45 Minutes Elliott Wave Chart


