
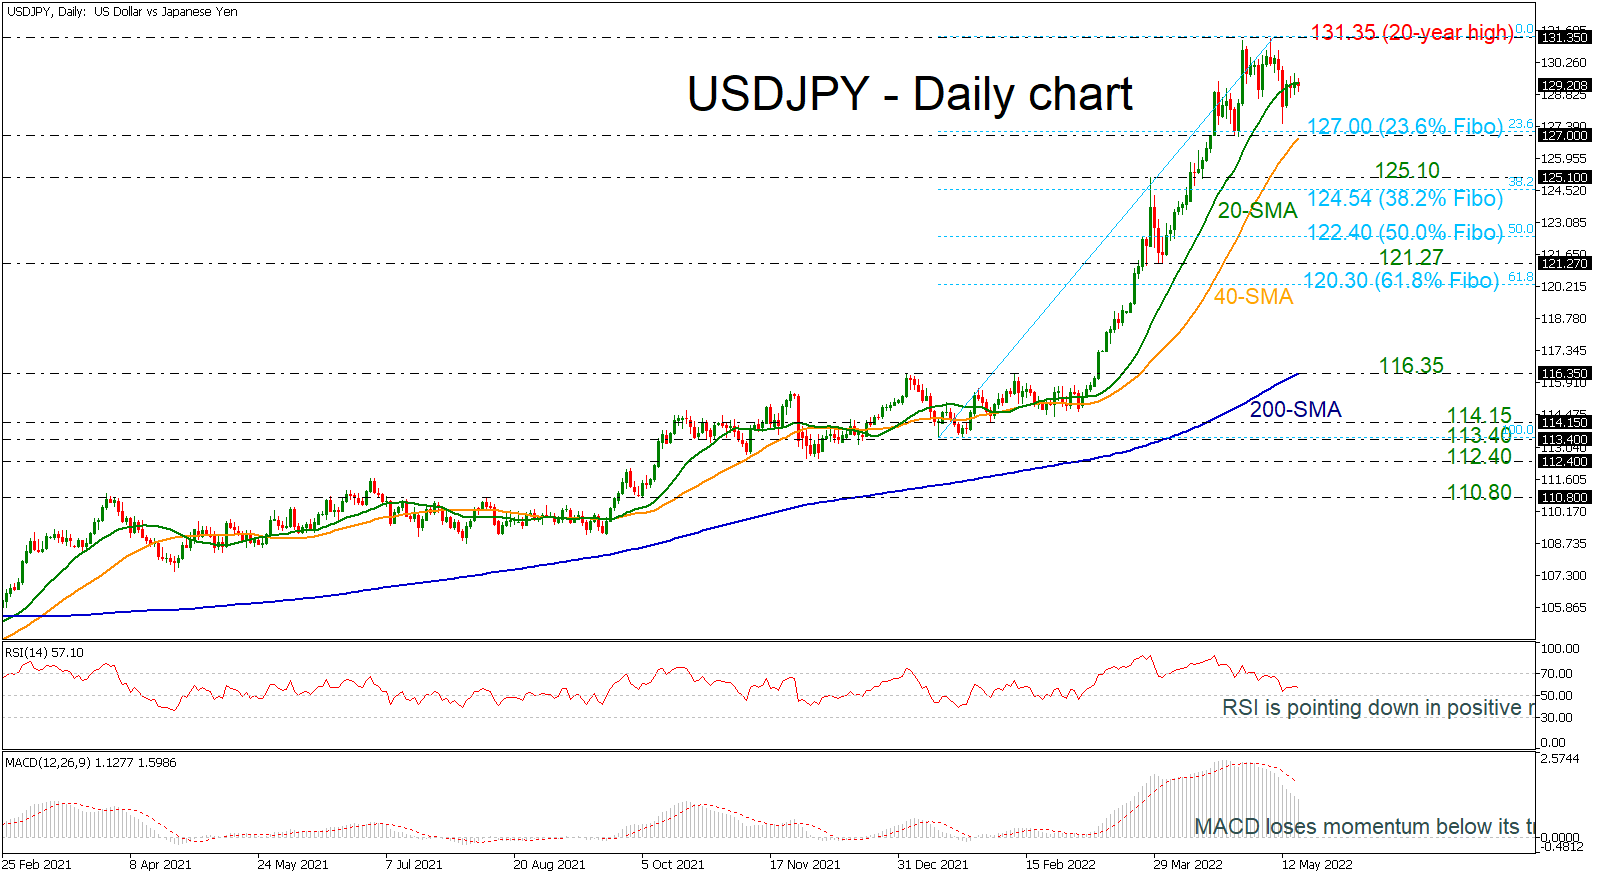
USDJPY is heading sideways, back and forth of the 20-day simple moving average (SMA) slightly above the 129.00 round number. The weak momentum is mirroring in the technical indicators as well, as the RSI is pointing slightly lower in the positive region, while the MACD is moving lower below its trigger line.
In the event the bulls take control again, the 20-year high of 131.35 will come first into view. A violation at this point may see another challenge battle around the 135.20, taken from the high in January 2002.
Should the bears dominate, driving the price below the 20-day SMA, the spotlight will shift to the 23.6% Fibonacci retracement level of the up leg from 113.40 to 131.35 around 127.00, which overlaps with the 40-day SMA. Any step lower will put the pair in a neutral mode, testing 125.10. Slightly lower, the 38.2% Fibonacci of 124.54 and the 50.0% Fibonacci of 122.40 may attract traders’ attention.
In brief, USDJPY continues to be in positive territory, but only a climb above the previous peak of 131.35 could endorse the bullish outlook.


