
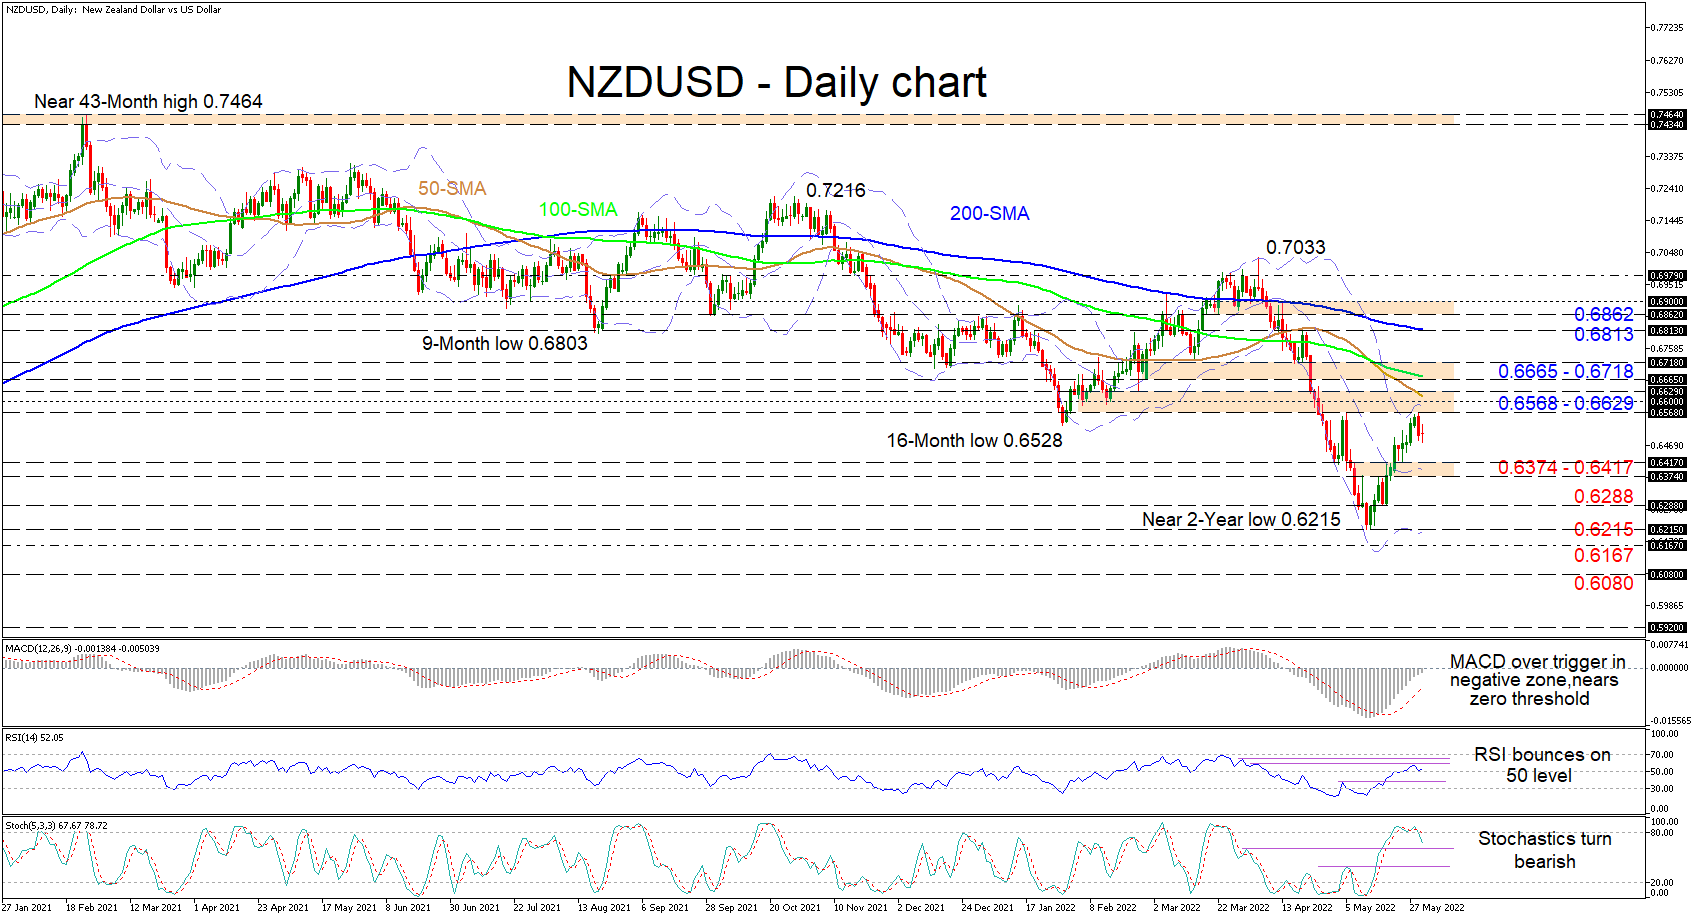
NZDUSD is fading from the vicinity of the upper Bollinger band that is just shy of the 0.6600 handle, both being upside deterrents, which are encapsulated in a resistance boundary established by the May 5 high of 0.6568 and the February 24 inside swing low of 0.6629. The gliding longer-term 100- and 200-day simple moving averages (SMAs), and the diving 50-day SMA, are still promoting the negative trend despite the bounce in the pair from the near two-year low of 0.6215, which has faltered under overwhelming negative obstacles.
The short-term oscillators are currently exhibiting mixed signals in momentum and have yet to compliment a clear direction. The MACD is promoting strong positive forces, improving over its red trigger line towards the zero mark, while the RSI is pointing higher just above the 50 threshold. Meanwhile, the negatively charged stochastic oscillator is suggesting additional dwindling in the price of the pair.
If NZDUSD continues to recede, support could commence from the 0.6374-0.6417 zone that is reinforced by the mid-Bollinger band. In the event downward forces intensify, the 0.6288 low may draw traders’ attention prior to the 0.6215 trough coming under attack. Should sellers sustain command and steer the price past the near two-year low of 0.6215, where the lower Bollinger band also resides, the 0.6167 barrier that extends back to May 2020 could provide downside friction ahead of the 0.6080 mid-May 2020 low.
Otherwise, if buyers re-emerge, profound resistance could stem from the immediate 0.6568 until 0.6629 region. The bulls are not out of the woods even if they overcome this reinforced boundary that contains the upper Bollinger band, the 0.6600 border, and the falling 50-day SMA. This is because an adjacent opposing zone from 0.6665-0.6718 could mute positive developments from gaining further ground. However, if buyers are triumphant, the price may then jump for the 0.6813 high, in line with the 200-day SMA, before challenging the 0.6862-0.6900 resistance band.
Summarizing, NZDUSD’s newfound positive traction over the last two-weeks seems to be running on fumes as bearish forces weigh on the positive outlook. Negative impetus may speed up with a break below the mid-Bollinger band. Yet, for optimism to grow in the pair, the price would need to improve over the 0.6665-0.6718 obstacle.


