
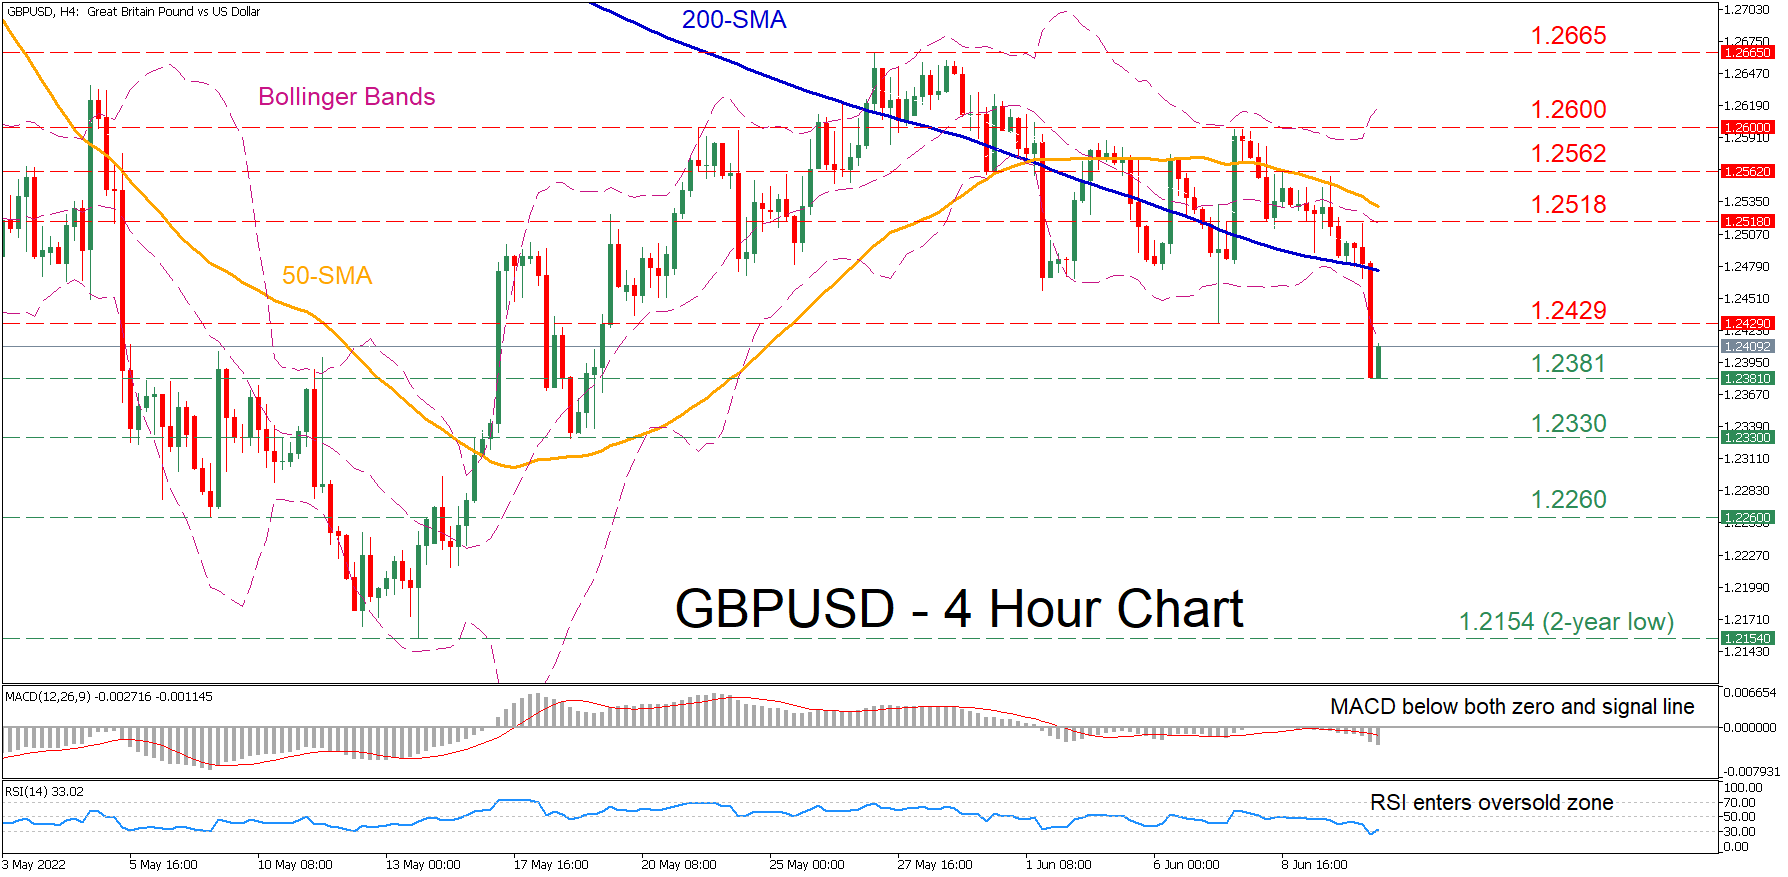
GBPUSD has been in a downtrend after it failed to jump beyond the 1.2600 region, generating a profound structure of lower highs and lower lows. Additionally, the price has sharply dropped beneath both the 200-period simple moving average (SMA) and the lower Bollinger band, endorsing a broader bearish short-term picture.
The short-term oscillators also confirm that bearish forces are in total control. Specifically, the RSI has entered its 30-oversold area, while the MACD histogram is currently beneath both zero and its red signal line.
Should selling interest intensify, the 1.2381 hurdle might act as immediate support for the pair. If that floor collapses, the price could descend towards 1.2330 or lower to test the 1.2260 obstacle. A violation of the latter could set the stage for the two-year low of 1.2154.
On the flipside, should negative momentum wane and the price reverses upwards, initial resistance could be encountered at the previous support region of 1.2429. Violating this area, the bulls could aim for 1.2518 before the spotlight turns to the 1.2562 barrier. Higher, further advances could then cease at the 1.2600 psychological mark.
In brief, GBPUSD’s short-term picture seems to be deteriorating as it experiences a new wave of downside pressures. For that bearish tone to reverse, the price needs to clearly jump above the 1.2600 ceiling.


