
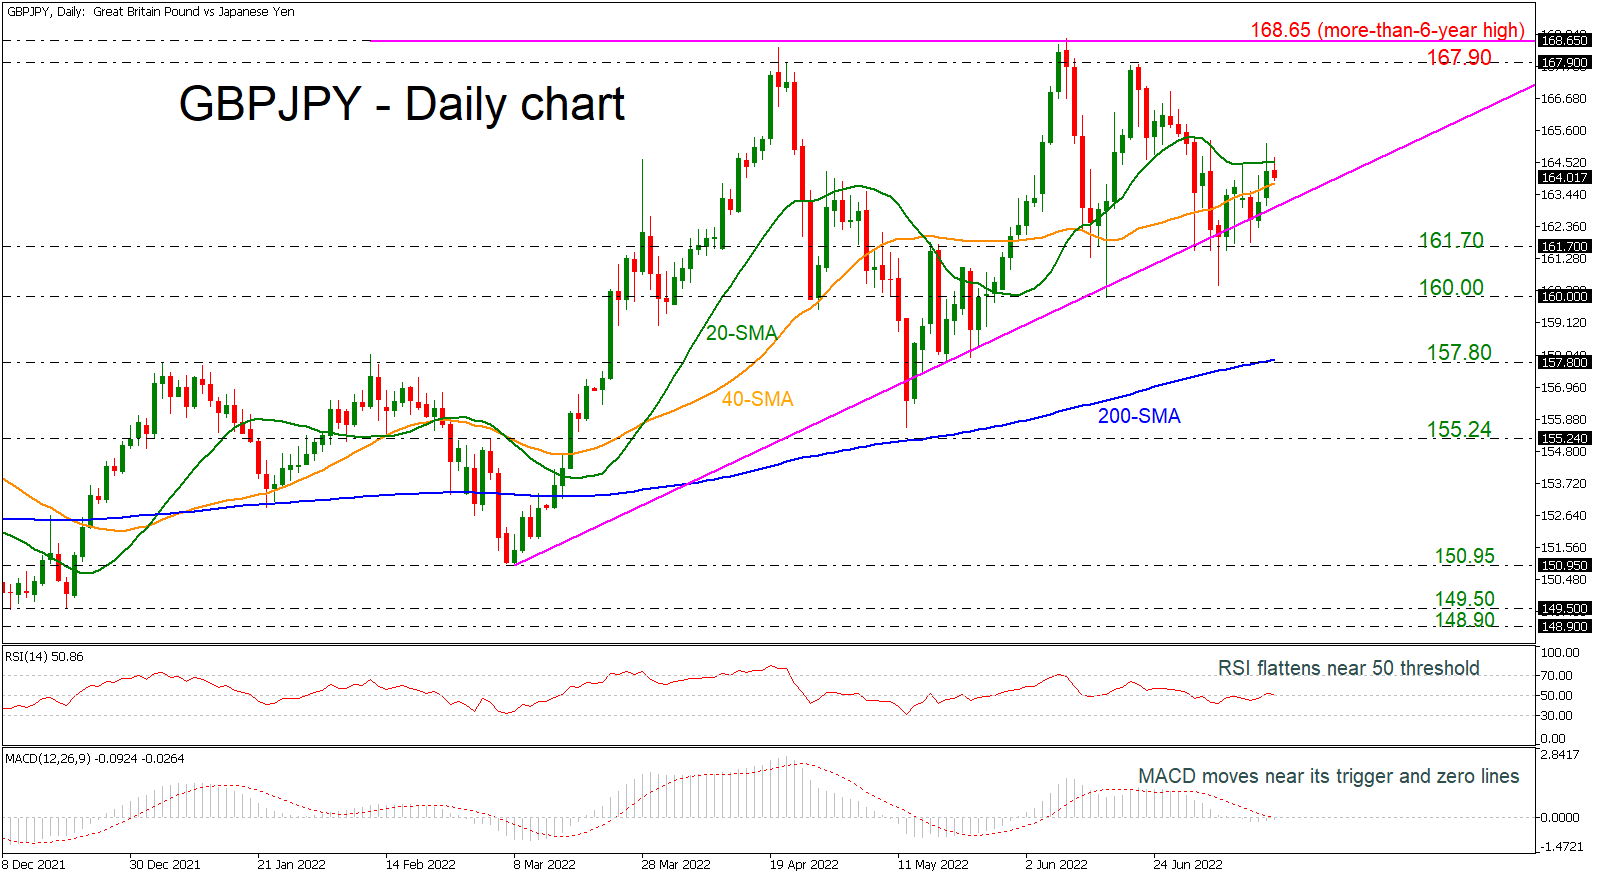
GBPJPY is remaining within an ascending triangle pattern, as it rebounded several times in the previous sessions on the uptrend line.
The pair is hovering within the short-term simple moving averages (SMAs), suggesting some weakening bias as the technical indicators are also failing to show some clear directional movement. The RSI is flattening near the neutral threshold of 50, while the MACD is moving sideways near its trigger and zero lines.
If the bulls manage to take charge and drive the market above the 20-day SMA, then the expectation is a test of the 167.90 barrier ahead of the more-than-six-year high of 168.65. Such a break would confirm a forthcoming higher high and may pave the way towards the next obstacle of 175.00, registered in April 2015.
A clear dip below the uptrend line would bring the pair within the 161.70 support and may set the stage for declines towards the 160.00 psychological mark. More declines may shift the outlook to bearish if the market penetrates the 200-day SMA at 157.80 as well.
All in all, GBPJPY has been developing within a triangle pattern since March and only a jump above 168.65 or below the rising trend line may change the current outlook.


