
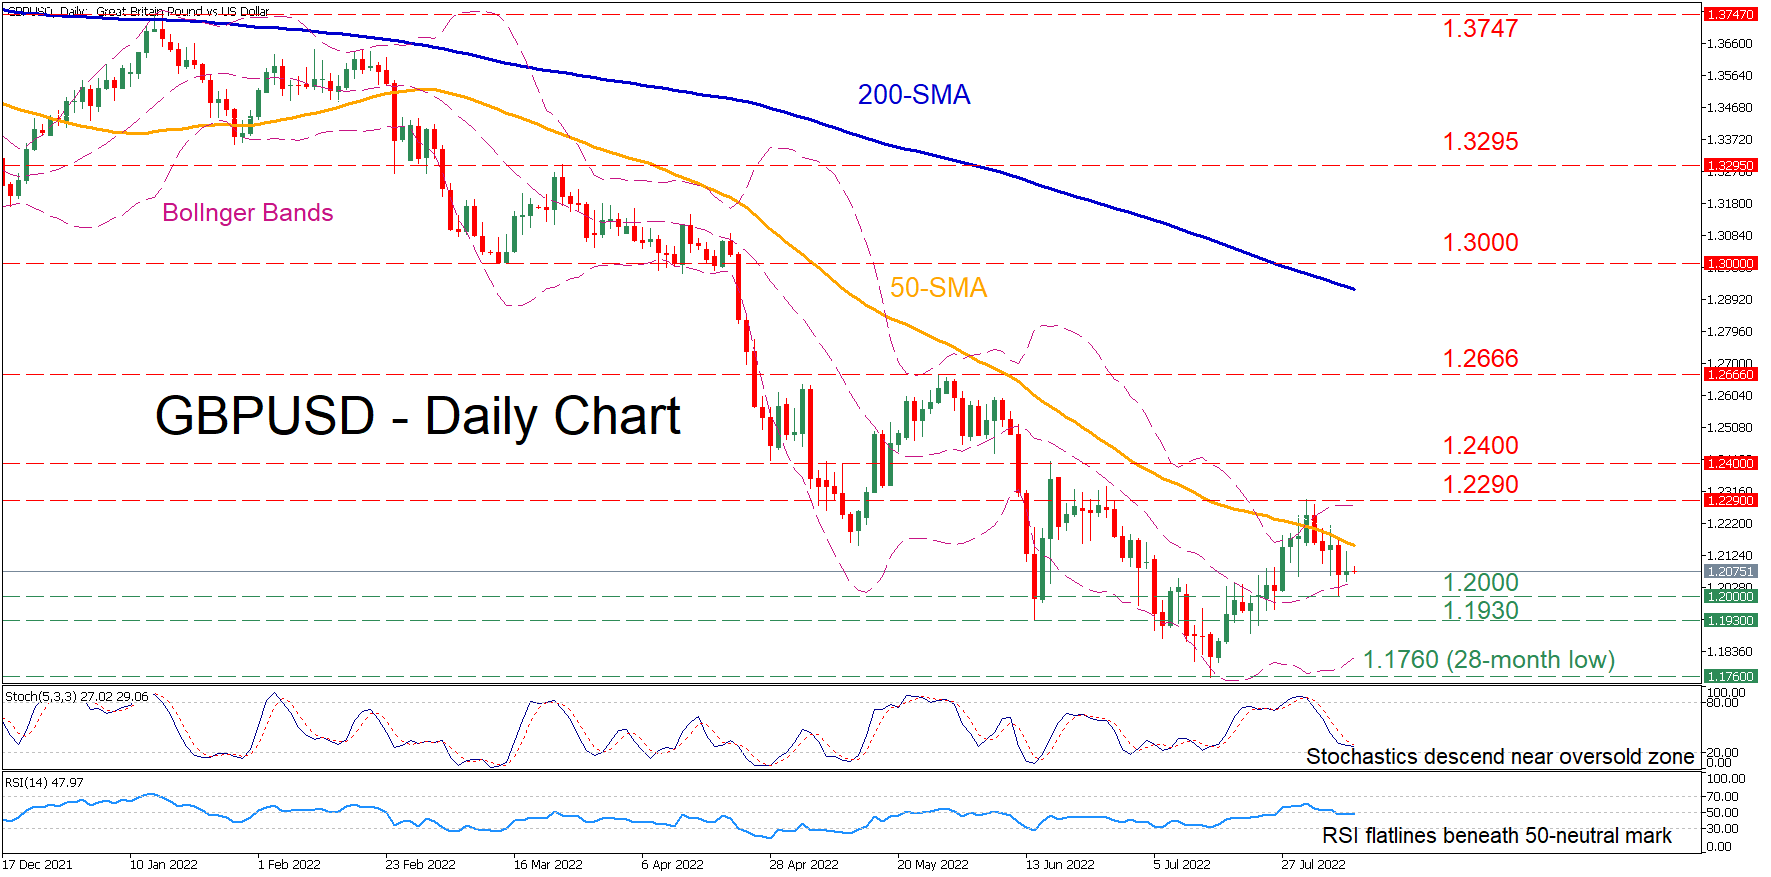
GBPUSD has been in a prolonged downtrend since the beginning of the year, creating a clear structure of lower highs and lower lows. Although the pair managed to faintly bounce back after its downfall halted at the 28-month low of 1.1760, the price has been repeatedly held down by the 50-day simple moving average (SMA) in the last few daily sessions.
The momentum indicators reflect a cautiously negative tone. Specifically, the stochastic oscillator is descending near its 20-oversold area, while the RSI remains below its 50-neutral mark after its recent slump.
To the downside, bearish moves could initially stall at the recent low of 1.2000, which is also considered a crucial psychological mark. Sliding beneath that floor, the spotlight could turn to the June support of 1.1930. A violation of the latter may open the door for the 28-month low of 1.1760.
Alternatively, should the price jump above its 50-day SMA, immediate resistance could be encountered at the recent peak of 1.2290. Conquering this barricade, the bulls might aim for 1.2400 before the May high of 1.2666 comes under examination. Even higher, the pair could ascend to test the 1.3000 psychological mark.
Overall, GBPUSD’s short-term picture is likely to deteriorate even further as the descending 50-day SMA appears to be a tough resistance barrier for the bulls. For the recent rebound to resume, the price needs to decisively cross above the 1.2290 ceiling.


