
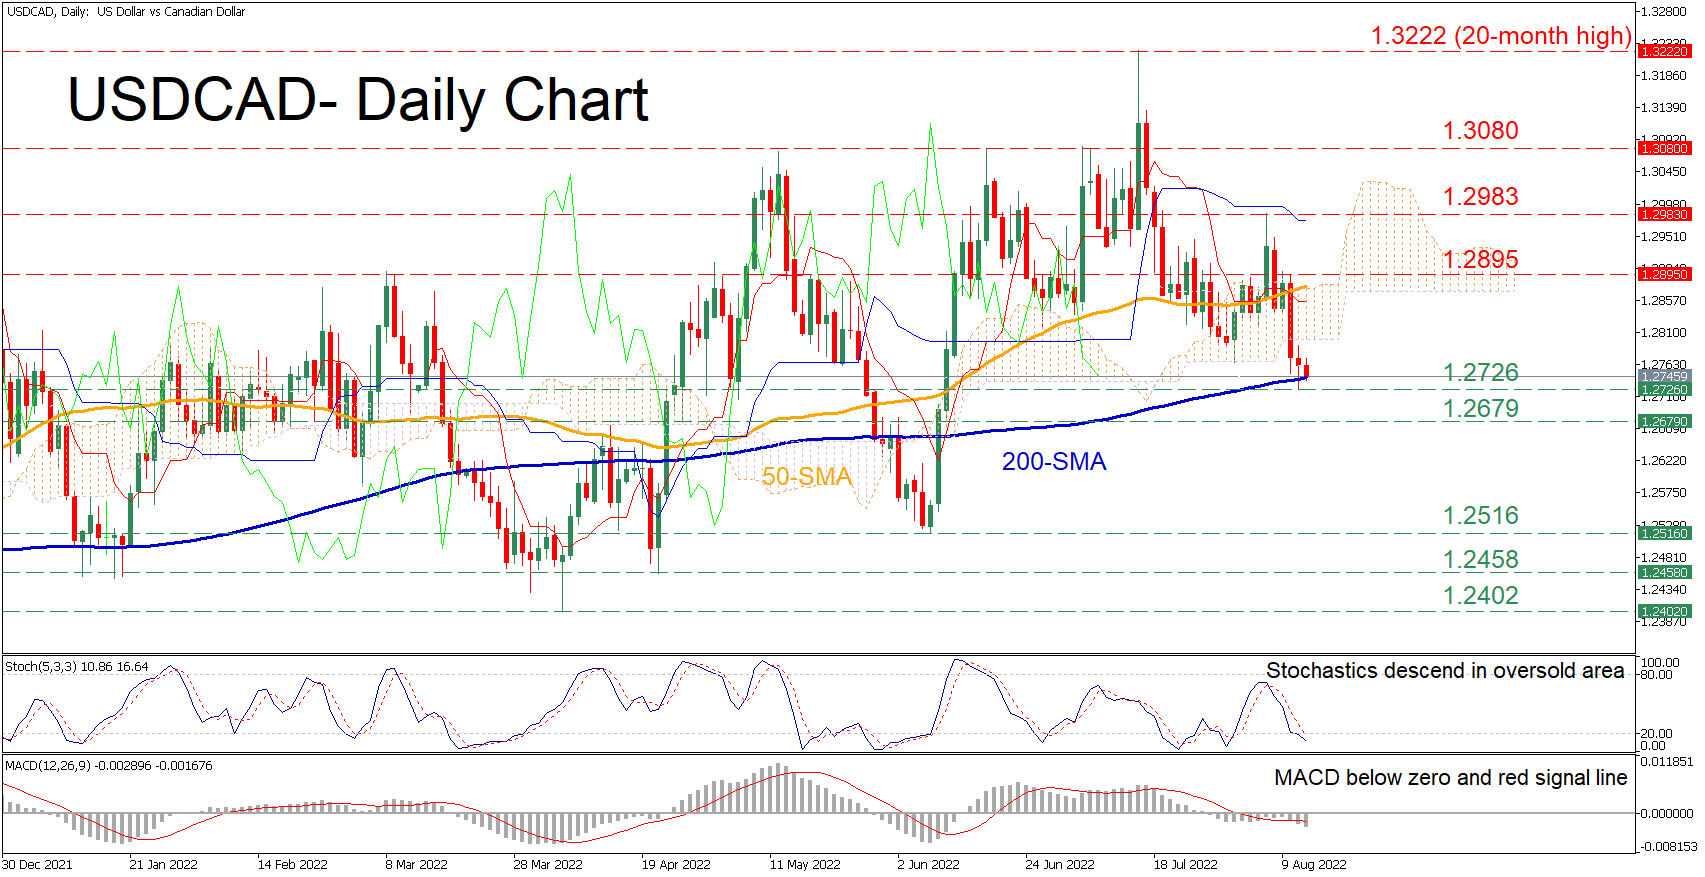
USDCAD has been losing ground in the short term since it peaked at the 20-month high of 1.3222 in mid-July. Moreover, in the last few sessions, the technical picture has deteriorated further, with the price crossing below both its 50-day simple moving average (SMA) and the Ichimoku cloud.
The momentum indicators are reflecting that the latest downside move could resume as near-term risks are tilted to the downside. Specifically, the stochastic oscillator is sloping downwards in the 20-oversold zone, while the MACD histogram is currently beneath both zero and its red signal line.
To the downside, should the price dive below crucial 200-day SMA, immediate support could be encountered at the recent low of 1.2726. Sliding beneath that floor, the 1.2679 barrier may come under examination before the pair challenges the June low of 1.2516. Any further price declines could then cease at the 1.2458 hurdle.
Alternatively, bullish actions might meet initial resistance at the 1.2895 region. Conquering this barricade, the bulls could aim for the recent peak of 1.2983. Failing to stop there, the price could ascend towards 1.3080 or higher to test the 20-month high of 1.3222.
In brief, even though USDCAD has been experiencing a sharp decline, the 200-day SMA appears to be acting as a strong floor. Hence, a violation of the latter could accelerate the downfall.


