
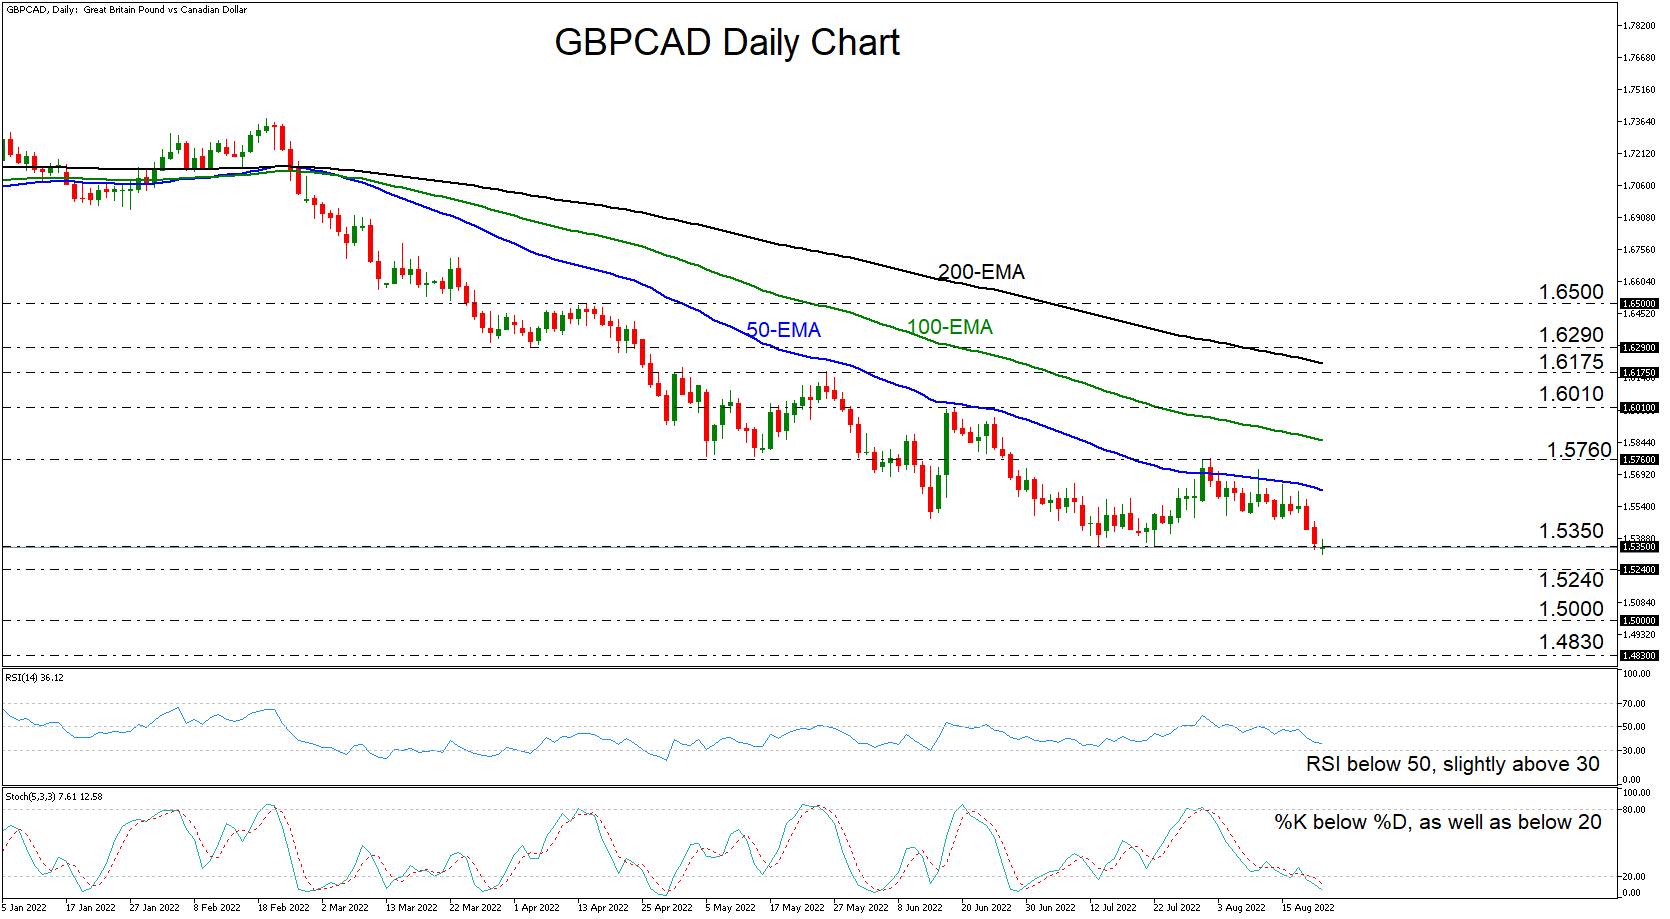
GBPCAD has been drifting south since August 2, when it hit resistance near 1.5760. That said, it has yet to clearly overcome the key support of 1.5350, a move which would not only confirm a forthcoming lower low, but also take the pair into territories last seen back in April 2013. Overall, the trend appears to be to the downside, a narrative supported by the fact that GBPCAD remains below all three of the plotted moving averages.
Our oscillators detect negative momentum, enhancing the case for another lower low very soon. The RSI runs slightly above 30 and points down, while in the stochastic, the %K lies below the %D, as well as below 20.
A clear close below 1.5350 may encourage the bears to flirt with the 1.5240 barrier, which attracted the buyers back in July 2011 and March 2013. If that zone fails to hold this time around, the trend could get extended towards the round figure of 1.5000, or even towards the 1.4830 zone, defined as a support by the lowest point of 2010.
The outlook could brighten upon a break above the 1.5760 barrier, marked by the peak of August 2. This could signal the completion of a double bottom formation on the daily chart, and may encourage advances towards the June 17 peak, at around 1.6010. Should the bulls surpass that obstacle as well, they could then climb towards the peak of May 26, at around 1.6175.
In brief, the broader path of GBPCAD remains to the downside, but before a trend continuation is examined, a clear dip below the key support zone of 1.5350 may be needed.


